India has been in lockdown since March 25, 2020. During this time, activities not contributing to the production and supply of essential goods and services were completely or partially suspended. Passenger trains and flights were halted. The lockdown has severely impacted migrants, several of whom lost their jobs due to shutting of industries and were stranded outside their native places wanting to get back. Since then, the government has announced relief measures for migrants, and made arrangements for migrants to return to their native place. The Supreme Court of India, recognising the problems faced by migrants stranded in different parts of the country, reviewed transportation and relief arrangements made by the government. On June 9, the Court directed central and state governments to complete transportation of remaining stranded migrants and expand focus of relief measures to facilitate employment for returning migrants. In this blog, we highlight some facts about migration in India, summarise key relief measures announced by the government and directives issued by the Supreme Court for the migrant population in relation to the lockdown.
Overview of Migration
Migration is the movement of people away from their usual place of residence, across either internal (within country) or international (across countries) borders. The latest government data on migration comes from the 2011 Census. As per the Census, India had 45.6 crore migrants in 2011 (38% of the population) compared to 31.5 crore migrants in 2001 (31% of the population). Between 2001 and 2011, while population grew by 18%, the number of migrants increased by 45%. In 2011, 99% of total migration was internal and immigrants (international migrants) comprised 1%.[1]
Patterns of migration
Internal migrant flows can be classified on the basis of origin and destination. One kind of classification is: i) rural-rural, ii) rural-urban, iii) urban-rural and iv) urban-urban. As per the 2011 census, there were 21 crore rural-rural migrants which formed 54% of classifiable internal migration (the Census did not classify 5.3 crore people as originating from either rural or urban areas). Rural-urban and urban-urban movement accounted for around 8 crore migrants each. There were around 3 crore urban-rural migrants (7% of classifiable internal migration).
Another way to classify migration is: (i) intra-state, and (ii) inter-state. In 2011, intra-state movement accounted for almost 88% of all internal migration (39.6 crore persons).1
There is variation across states in terms of inter-state migration flows. According to the 2011 Census, there were 5.4 crore inter-state migrants. As of 2011, Uttar Pradesh and Bihar were the largest source of inter-state migrants while Maharashtra and Delhi were the largest receiver states. Around 83 lakh residents of Uttar Pradesh and 63 lakh residents of Bihar had moved either temporarily or permanently to other states. Around 60 lakh people from across India had migrated to Maharashtra by 2011.
Figure 1: Inter-state Migration (in lakh)

Note: A net out-migrant state is one where more people migrate out of the state than those that migrate into the state. Net in-migration is the excess of incoming migrants over out-going migrants.
Sources: Census 2011; PRS.
Reasons for internal migration and size of migrant labour force
As of 2011, majority (70%) of intra-state migration was due to reasons of marriage and family with variation between male and female migrants. While 83% of females moved for marriage and family, the corresponding figure for males was 39%. Overall, 8% of people moved within a state for work (21% of male migrants and 2% of female migrants).
Movement for work was higher among inter-state migrants- 50% of male and 5% of female inter-state migrants. As per the Census, there were 4.5 crore migrant workers in 2011. However, according to the Working Group Report on Migration, the Census underestimates the migrant worker population. Female migration is recorded as movement due to family since that is the primary reason. However, many women take up employment after migrating which is not reflected in the number of women moving for work-related reasons. [2]
According to the Economic Survey, 2016-17, Census data also underestimates temporary migrant labour movement. In 2007-08, the NSSO estimated the size of India’s migrant labour at seven crore (29% of the workforce). The Economic Survey, 2016-17, estimated six crore inter-state labour migrants between 2001-2011. The Economic Survey also estimated that in each year between 2011-2016, on average 90 lakh people travelled for work.
Figure 2: Reasons for intra-state migration

Sources: Census 2011; PRS.
Figure 3:Reasons for inter-state migration

Sources: Census 2011; PRS.
Issues faced by migrant labour
Article 19(1)(e) of the Constitution, guarantees all Indian citizens the right to reside and settle in any part of the territory of India, subject to reasonable restrictions in the interest of the general public or protection of any scheduled tribe. However, people migrating for work face key challenges including: i) lack of social security and health benefits and poor implementation of minimum safety standards law, ii) lack of portability of state-provided benefits especially food provided through the public distribution system (PDS) and iii) lack of access to affordable housing and basic amenities in urban areas. 2
Poor implementation of protections under the Inter-State Migrant Workmen Act, 1979 (ISMW Act)
The ISMW Act provides certain protections for inter-state migrant workers. Labour contractors recruiting migrants are required to: (i) be licensed, (ii) register migrant workers with the government authorities, and (iii) arrange for the worker to be issued a passbook recording their identity. Guidelines regarding wages and protections (including accommodation, free medical facilities, protective clothing) to be provided by the contractor are also outlined in the law.
In December 2011, a report by the Standing Committee on Labour observed that registration of workers under the ISMW Act was low and implementation of protections outlined in the Act was poor. The report concluded that the Central government had not made any concrete and fruitful efforts to ensure that contractors and employers mandatorily register the workers employed with them enabling access to benefits under the Act.
Lack of portability of benefits
Migrants registered to claim access to benefits at one location lose access upon migration to a different location. This is especially true of access to entitlements under the PDS. Ration card required to access benefits under the PDS is issued by state governments and is not portable across states. This system excludes inter-state migrants from the PDS unless they surrender their card from the home state and get a new one from the host state.
Lack of affordable housing and basic amenities in urban areas
The proportion of migrants in urban population is 47%.1 In 2015, the Ministry of Housing and Urban Affairs identified migrants in urban areas as the largest population needing housing in cities. There is inadequate supply of low-income ownership and rental housing options. This leads to the spread of informal settlements and slums. The Prime Minister Awaas Yojana (PMAY) is a central government scheme to help the economically weaker section and low-income group access housing. Assistance under the scheme includes: i) slum rehabilitation, ii) subsidised credit for home loans, iii) subsidies up to Rs 1.5 lakh to either construct a new house or enhance existing houses on their own and iv) increasing availability of affordable housing units in partnership with the private sector. Since housing is a state subject, there is variation in approach of States towards affordable housing.2
Steps taken by the government with regard to migrant labour during the lockdown
During the lockdown, several inter-state migrant workers tried to return to their home state. Due to the suspension public transport facilities, migrants started walking towards their home state on foot. Subsequently, buses and Shramik special trains were permitted by the central government subject to coordination between states.[3],[4] Between May 1 and June 3, more than 58 lakh migrants were transported through specially operated trains and 41 lakh were transported by road. Measures taken by the government to aid migrants include-
Transport: On March 28, the central government authorised states to use the State Disaster Response Fund to provide accommodation to traveling migrants. States were advised to set up relief camps along highways with medical facilities to ensure people stay in these camps while the lockdown is in place.
In an order issued on April 29, the Ministry of Home Affairs allowed states to co-ordinate individually to transport migrants using buses. On May 1, the Indian Railways resumed passenger movement (for the first time since March 22) with Shramik Special trains to facilitate movement of migrants stranded outside their home state. Between May 1 and June 3, Indian Railways operated 4,197 Shramik trains transporting more than 58 lakh migrants. Top states from where Shramik trains originated are Gujarat and Maharashtra and states where the trains terminated are Uttar Pradesh and Bihar.[5] Note that these trends largely correspond to the migration patterns seen in the 2011 census data.
Food distribution: On April 1, the Ministry of Health and Family Affairs directed state governments to operate relief camps for migrant workers with arrangements for food, sanitation and medical services. On May 14, under the second tranche of the Aatma Nirbhar Bharat Abhiyaan, the Finance Minister announced that free food grains would be provided to migrant workers who do not have a ration card for two months. The measure is expected to benefit eight crore migrant workers and their families. The Finance Minister also announced that One Nation One Ration card will be implemented by March 2021, to provide portable benefits under the PDS. This will allow access to ration from any Fair Price Shop in India.
Housing: The Aatma Nirbhar Bharat Abhiyaan also launched a scheme for Affordable Rental Housing Complexes for Migrant Workers and Urban Poor to provide affordable rental housing units under PMAY. The scheme proposes to use existing housing stock under the Jawaharlal Nehru National Urban Housing Mission (JnNURM) as well as incentivise public and private agencies to construct new affordable units for rent. Further, additional funds have been allocated for the credit linked subsidy scheme under PMAY for middle income group.
Financial aid: Some state governments (like Bihar, Rajasthan and Madhya Pradesh) announced one-time cash transfers for returning migrant workers. UP government announced the provision of maintenance allowance of Rs 1,000 for returning migrants who are required to quarantine.
Directions by the Supreme Court
The Supreme Court reviewed the situation of migrant labourers stranded in different parts of the country, noting inadequacies and lapses in government response to the situation.
[1] Census, 2011, Office of the Registrar General & Census Commissioner, Ministry of Home Affairs.
[2] Report of Working Group on Migration, Ministry of Housing and Urban Poverty Alleviation, January 2017, http://mohua.gov.in/upload/uploadfiles/files/1566.pdf.
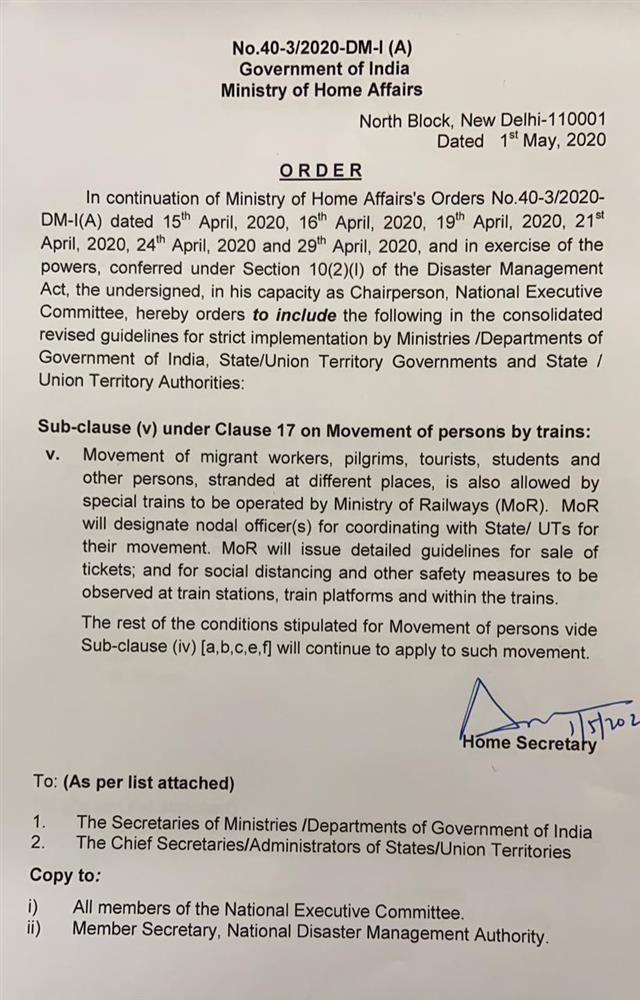
[3] Order No. 40-3/2020-DM-I (A), Ministry of Home Affairs, April 29, 2020, https://prsindia.org/files/covid19/notifications/4233.IND_Movement_of_Persons_April_29.pdf.
[4] Order No. 40-3/2020-DM-I (A), Ministry of Home Affairs, May 1, 2020, https://prsindia.org/files/covid19/notifications/IND_Special_Trains_May_1.jpeg.
[5] “Indian Railways operationalizes 4197 “Shramik Special” trains till 3rd June, 2020 (0900hrs) across the country and transports more than 58 lacs passengers to their home states through “Shramik Special” trains since May 1”, Press Information Bureau, Ministry of Railways, June 3, 2020, https://pib.gov.in/PressReleseDetail.aspx?PRID=1629043.
Last week, the Power Finance Corporation reported that state-owned power distribution companies across the country made financial losses amounting to Rs 68,832 crore in 2022-23. This is four times higher than the losses witnessed in 2021-22, and roughly equivalent to the annual budget of a state like Uttarakhand. This blog examines some of the causes and implications of such losses.
Overview of financial losses
For several years now, electricity distribution companies (discoms), which are mostly state-owned, have witnessed steep financial losses. Between 2017-18 and 2022-23, losses accumulated to over three lakh crore rupees. In 2021-22, discom witnessed substantial reduction in their losses, primarily because states released 1.54 lakh rupees in subsidies to clear pending dues. State governments provide discoms with subsidies, so that domestic and agricultural consumers receive affordable power. These payments are typically delayed which creates cash flow constraints, and leads to an accumulation of debt. In addition, costs incurred by discoms in 2021-22 remained unchanged.

Note: Data from 2020-21 onwards does not include Odisha, and Dadra & Nagar Haveli and Daman and Diu since their distribution function was privatised in 2020-21. Data for Ladakh is available from 2021-22 onwards. Data for Jammu and Kashmir is not available. The Delhi Municipal Council Distribution Utility has been included from 2020-21 onwards.
Sources: Power Finance Corporation reports for various years; PRS.
As of 2022-23, losses have increased again to reach Rs 68,832 crore. This increase has been driven by rising costs. At a per unit level, the cost of supplying one kilowatt of electricity rose from 7.6 rupees in 2021-22, to 8.6 rupees in 2022-23 (See Table 1).
Table 1: Financial details of state-owned power distribution companies
|
Details |
2019-20 |
2020-21 |
2021-22 |
2022-23 |
|
Average cost of supplying power (ACS) |
7.4 |
7.7 |
7.6 |
8.6 |
|
Average revenue realised (ARR) |
6.8 |
7.1 |
7.3 |
7.8 |
|
Per unit loss (ACS-ARR) |
0.6 |
0.6 |
0.3 |
0.7 |
|
Total losses (in Rs crore) |
-60,231 |
-76,899 |
-16,579 |
-68,832 |
Note: Data from 2020-21 onwards does not include Odisha, and Dadra & Nagar Haveli and Daman and Diu since their distribution function was privatised in 2020-21. Data for Ladakh is available from 2021-22 onwards. Data for Jammu and Kashmir is not available. The Delhi Municipal Council Distribution Utility has been included from 2020-21 onwards.
Sources: Power Finance Corporation reports for various years; PRS.
Purchase of electricity from generation companies (gencos) forms about 70% of a discom’s total costs, and coal is the primary source for generating electricity. The following chain of events took place in 2022-23: (i) consumer demand for electricity rose by 10% over the previous year, as compared to a 6% year-on-year increase in the past 10 years, (ii) coal had to be imported to meet the increased demand, and (iii) global coal prices were elevated.
Coal imported at elevated prices to keep up with rising electricity demand
In 2022-23, demand for electricity increased by 10% over 2021-22. Between 2008-09 and 2018-19, demand increased at an annual growth rate (CAGR) of 6%. Electricity demand grew as the economy grew (at 7%), and largely came from domestic and agricultural consumers. These consumer categories account for 54% of the total electricity sales, and their demand rose by 7%.

Sources: Central Electricity Regulatory Commission; PRS.
Electricity cannot be stored at scale, which means that generation must be scheduled depending on anticipated demand. The Central Electricity Authority anticipates annual demand for each year. It estimated that demand in 2022-23 would be at 1,505 billion units. However, the actual demand was higher than anticipated in the first few months of 2022-23 (See Figure 3).
To meet this demand, electricity generation had to be ramped up. Coal stocks had already depleted from 29 million tonnes in June 2021 to eight million tonnes in September 2021, on account of high demand in 2021-22. To ensure uninterrupted supply of power, the Ministry of Power directed gencos to import coal. The Ministry noted that without imports, widespread power cuts and blackouts would have occurred.

Sources: Load Generation Balance Report 2022 and 2023, Central Electricity Authority; PRS.
Coal imports rose by about 27 million tonnes in 2022-23. While this constituted only 5% of the overall coal used in the sector, the price at which it was imported significantly impacted the sector. In 2021-22, India imported coal at an average price of Rs 8,300 per tonne. This rose to Rs 12,500 per tonne in 2022-23, a 51% increase. Coal was primarily imported from Indonesia, and prices shot up due to the Russia-Ukraine war, and demand surge by countries like India and China.

Sources: Ministry of Power; Ministry of Statistics and Programme Implementation; PRS.
Coal import situation going forward
In January 2023, the Ministry of Power advised gencos to import 6% of the required coal, to ensure sufficient stock until September 2023. It noted that due to floods and variable rainfall in various parts of the country, hydro generation capacity reduced by about 14%. This put additional burden on coal based thermal generation in 2023-24. Following this, in October 2023, the Ministry directed all gencos to continue using at least 6% imported coal until March 2024.

Sources: Ministry of Coal; PRS.
Structural issues in the power sector and its impact on state finances
Discoms witness persistent financial losses due to certain structural issues. Their costs are typically high because of old contracts with generation companies (gencos). Power purchase costs in these contracts do not account for production efficiencies over the years, and costs remain unchanged. Tariffs are only revised every few years, to ensure that consumers are protected from supply chain shocks. As a result, costs are carried forward for a few years. In addition, discoms sell electricity to certain consumers such as agricultural and residential consumers, below cost. This is supposed to primarily be recovered through subsidy grants provided by state governments. However, states often delay subsidy payments leading to cash flow issues, and accumulation of debt. In addition, tariff recovery from the power sold is not optimal.
Losses reported in the generation sector have also increased. In 2022-23, state-owned gencos reported losses worth Rs 7,175 crore, as compared to the Rs 4,245 crore in 2021-22. Rajasthan accounted for 87% of these, at Rs 6,278 crore. Note that under the Late Payment Surcharge Rules, 2022, discoms are required to make upfront payments to gencos.
Risk to state finances
Persistent financial losses, high debt and guarantees extended by states continue to pose a risk to state finances. These are contingent liabilities for state governments, i.e., in the event a discom is unable to repay its debt, the state would have to take it over.
Several such schemes have been introduced in the past to bail discoms out (See Table 2). As of 2022-23, discoms have an outstanding debt worth Rs 6.61 lakh crore, 2.4% of the national GDP. Debt is significantly high in states such as Tamil Nadu (6% of GSDP), Rajasthan (6% of GSDP), and Uttar Pradesh (3% of GSDP). Previous Finance Commissions have recognised that strengthening discom finances is key in minimising the risk to state finances.
Table 2: Key government schemes for the turnaround of the distribution sector over the years
|
Year |
Scheme |
Details |
|
2002 |
Bailout Package |
States take over the debt of state electricity boards worth Rs 35,000 crore, 50% waiver of interest payable by state electricity boards to central PSUs |
|
2012 |
Financial Restructuring Package |
States take over 50% of the outstanding short-term liabilities worth Rs 56,908 crore |
|
2015 |
Ujwal Discom Assurance Yojana (UDAY) |
States take over 75% of the debt of discoms worth Rs 2.3 lakh crore and also provide grants for any future losses |
|
2020 |
Liquidity Infusion Scheme |
Discoms get loans worth Rs 1.35 lakh crore from Power Finance Corporation and REC Limited to settle outstanding dues of generators, state governments provide guarantee |
|
2022 |
Revamped Distribution Sector Scheme |
Central government to provide result-linked financial assistance worth Rs 97,631 crore for strengthening of supply infrastructure |
Sources: NITI Aayog, Press Releases of the Ministry of Power; PRS.
For more details on the impact of discom finances on state finances, see here. For more details on structural issues in the power distribution sector, see here.
ANNEXURE
Table 3: Cost and revenue structure of discoms on energy sold basis (in Rs per kw)
|
Details |
2019-20 |
2020-21 |
2021-22 |
2022-23 |
|
Average cost of supplying power (ACS) |
7.4 |
7.7 |
7.6 |
8.6 |
|
of which |
||||
|
Cost of procuring power |
5.8 |
5.9 |
5.8 |
6.6 |
|
Average revenue realised (ARR) |
6.8 |
7.1 |
7.3 |
7.8 |
|
of which |
||||
|
Revenue from sale of power |
5.0 |
4.9 |
5.1 |
5.5 |
|
Tariff subsidy |
1.3 |
1.4 |
1.4 |
1.5 |
|
Regulatory income and revenue grant under UDAY |
0.3 |
0.1 |
0.0 |
0.2 |
|
Per unit loss |
0.6 |
0.6 |
0.3 |
0.7 |
|
Total financial losses |
-60,231 |
-76,899 |
-16,579 |
-68,832 |
Sources: Power Finance Corporation reports for various years; PRS.
Table 4: State-wise profit/loss of power distribution companies (in Rs crore)
|
State/UT |
2017-18 |
2018-19 |
2019-20 |
2020-21 |
2021-22 |
2022-23 |
|
Andaman and Nicobar Islands |
-605 |
-645 |
-678 |
-757 |
-86 |
-76 |
|
Andhra Pradesh |
-546 |
-16,831 |
1,103 |
-6,894 |
-2,595 |
1,211 |
|
Arunachal Pradesh |
-429 |
-420 |
NA |
NA |
NA |
NA |
|
Assam |
-259 |
311 |
1,141 |
-107 |
357 |
-800 |
|
Bihar |
-1,872 |
-1,845 |
-2,913 |
-2,966 |
-2,546 |
-10 |
|
Chandigarh |
321 |
131 |
59 |
79 |
-101 |
NA |
|
Chhattisgarh |
-739 |
-814 |
-571 |
-713 |
-807 |
-1,015 |
|
Dadra & Nagar Haveli and Daman & Diu |
312 |
-149 |
-125 |
NA |
NA |
NA |
|
Delhi |
NA |
NA |
NA |
98 |
57 |
-141 |
|
Goa |
26 |
-121 |
-276 |
78 |
117 |
69 |
|
Gujarat |
426 |
184 |
314 |
429 |
371 |
147 |
|
Haryana |
412 |
281 |
331 |
637 |
849 |
975 |
|
Himachal Pradesh |
-44 |
132 |
43 |
-153 |
-141 |
-1,340 |
|
Jharkhand |
-212 |
-730 |
-1,111 |
-2,556 |
-1,721 |
-3,545 |
|
Karnataka |
-2,439 |
-4,889 |
-2,501 |
-5,382 |
4,719 |
-2,414 |
|
Kerala |
-784 |
-135 |
-270 |
-483 |
98 |
-1,022 |
|
Ladakh |
NA |
NA |
NA |
NA |
-11 |
-57 |
|
Lakshadweep |
-98 |
-120 |
-115 |
-117 |
NA |
NA |
|
Madhya Pradesh |
-5,802 |
-9,713 |
-5,034 |
-9,884 |
-2,354 |
1,842 |
|
Maharashtra |
-3,927 |
2,549 |
-5,011 |
-7,129 |
-1,147 |
-19,846 |
|
Manipur |
-8 |
-42 |
-15 |
-15 |
-22 |
-146 |
|
Meghalaya |
-287 |
-202 |
-443 |
-101 |
-157 |
-193 |
|
Mizoram |
87 |
-260 |
-291 |
-115 |
-59 |
-158 |
|
Nagaland |
-62 |
-94 |
-477 |
-17 |
24 |
33 |
|
Puducherry |
5 |
-39 |
-306 |
-23 |
84 |
-131 |
|
Punjab |
-2,760 |
363 |
-975 |
49 |
1,680 |
-1,375 |
|
Rajasthan |
-11,314 |
-12,524 |
-12,277 |
-5,994 |
2,374 |
-2,024 |
|
Sikkim |
-29 |
-3 |
-179 |
-34 |
NA |
71 |
|
Tamil Nadu |
-12,541 |
-17,186 |
-16,528 |
-13,066 |
-9,130 |
-9,192 |
|
Telangana |
-6,697 |
-9,525 |
-6,966 |
-6,686 |
-831 |
-11,103 |
|
Tripura |
28 |
38 |
-104 |
-4 |
-127 |
-193 |
|
Uttar Pradesh |
-5,269 |
-5,902 |
-3,866 |
-10,660 |
-6,498 |
-15,512 |
|
Uttarakhand |
-229 |
-808 |
-323 |
-152 |
-21 |
-1,224 |
|
West Bengal |
-871 |
-1,171 |
-1,867 |
-4,261 |
1,045 |
-1,663 |
|
State Sector |
-56,206 |
-80,179 |
-60,231 |
-76,899 |
-16,579 |
-68,832 |
|
Dadra & Nagar Haveli and Daman & Diu |
NA |
NA |
NA |
242 |
148 |
104 |
|
Delhi |
109 |
657 |
-975 |
1,876 |
521 |
-76 |
|
Gujarat |
574 |
307 |
612 |
655 |
522 |
627 |
|
Odisha |
NA |
NA |
-842 |
-853 |
940 |
746 |
|
Maharashtra |
NA |
590 |
1,696 |
-375 |
360 |
42 |
|
Uttar Pradesh |
182 |
126 |
172 |
333 |
256 |
212 |
|
West Bengal |
658 |
377 |
379 |
398 |
66 |
-12 |
|
Private Sector |
1,523 |
2,057 |
1,042 |
2,276 |
2,813 |
1,643 |
|
All-India |
-54,683 |
-78,122 |
-59,189 |
-77,896 |
-13,766 |
-67,189 |
Note: Minus sign (-) indicates loss; Dadra & Nagar Haveli and Daman & Diu discom was privatised on April 1, 2022; New Delhi Municipal Council Distribution utility has been added from 2020-21 onwards.
Sources: Power Finance Corporation reports for various years; PRS.

