On June 1, 2020, the Cabinet Committee on Economic Affairs approved a revision in the definition of Micro, Small and Medium Enterprises (MSMEs).[1] In this blog, we discuss the change in the definition as approved by the Cabinet, and examine some of the common criteria used for classification of MSMEs.
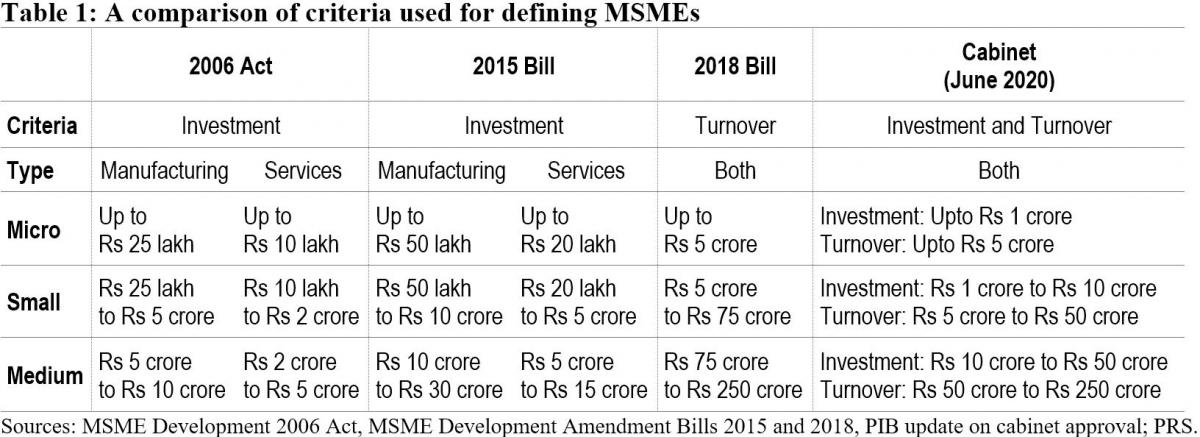
Currently, MSMEs are defined under the Micro, Small and Medium Enterprises Development Act, 2006.[2] The Act classifies them as micro, small and medium enterprises based on: (i) investment in plant and machinery for enterprises engaged in manufacturing or production of goods, and (ii) investment in equipment for enterprises providing services. As per the Cabinet approval, the investment limits will be revised upwards and annual turnover of the enterprise will be used as additional criteria for the classification of MSMEs (Table 1).
Earlier attempts to amend the definition of MSMEs
The central government has sought to revise the definition of MSMEs in the Act on two earlier occasions. The government introduced the MSME Development (Amendment) Bill, 2015 which proposed to increase the investment limits for manufacturing and services MSMEs.[3] This Bill was withdrawn in July 2018 and another Bill was introduced. The MSME Development (Amendment) Bill, 2018 proposed to: (i) use annual turnover as criteria instead of investment for classification of MSMEs, (ii) remove the distinction between manufacturing and services, and (iii) provide the central government with the power to revise the turnover limits, through a notification.[4] The 2018 Bill lapsed with the dissolution of 16th Lok Sabha.
Global trends in criteria for the classification of MSMEs
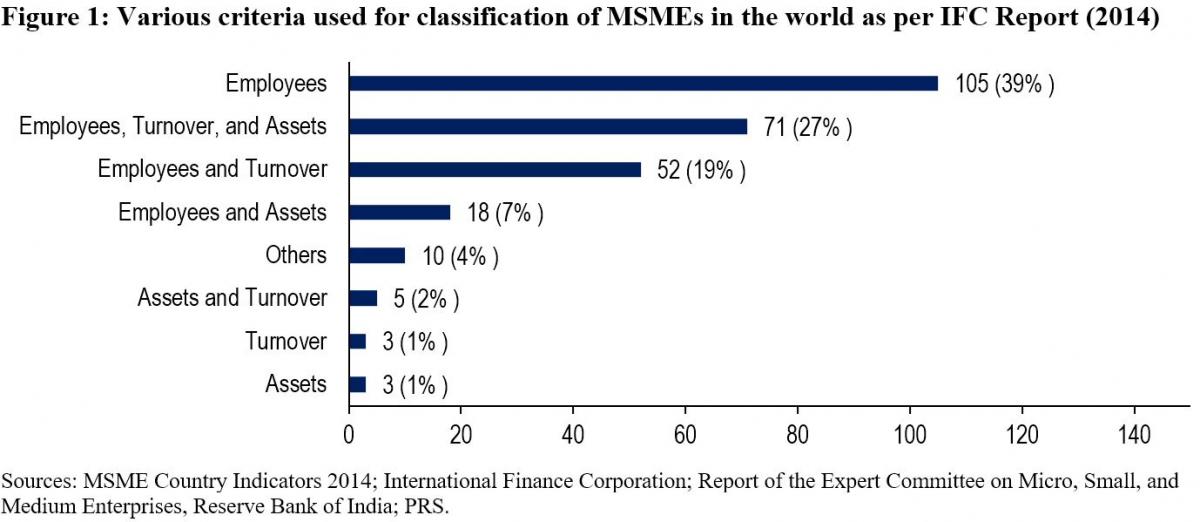
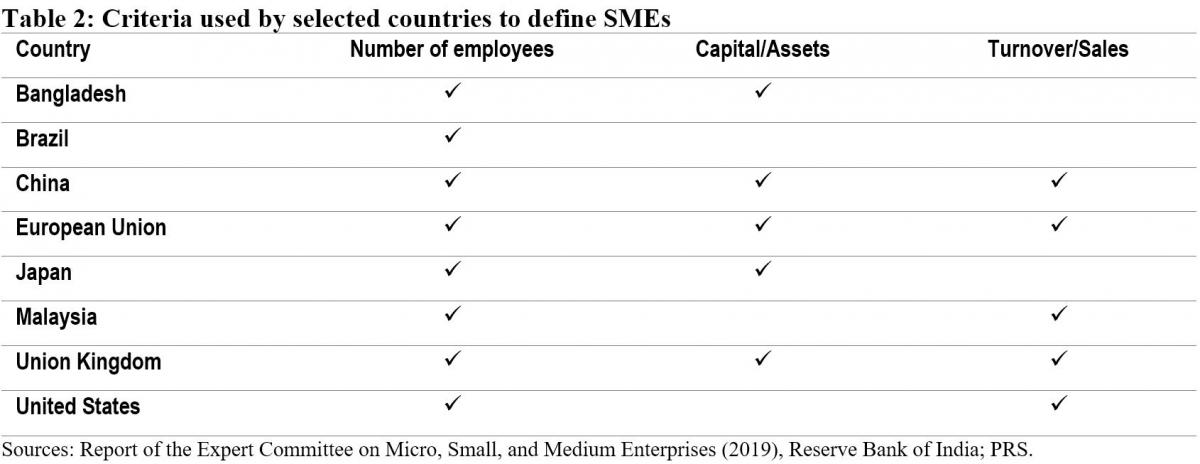
While India will now be using investment and annual turnover as the criteria to classify MSMEs, globally, the number of employees is the most widely used criteria for classifying MSMEs. The Reserve Bank of India's Expert Committee on MSMEs (2019) cited a study by the International Finance Corporation in 2014 which analysed 267 definitions used by different institutions in 155 countries.[5],[6] According to the study, countries used a combination of criteria to classify MSMEs. 92% of the definitions used the number of employees as one of the criteria. Other frequently used criteria were: (i) turnover (49%), and (ii) value of assets (36%). 11% of the analysed definitions used alternative criteria such as: (i) loan size, (ii) years of experience, and (iii) initial investment.
Evaluation of common criteria used to define MSMEs
Investment: The 2006 Act uses investment in plant, machinery, and equipment to classify MSMEs. Some of the issues with the investment criteria include:
Due to their informal and small scale of operations, firms often do not maintain proper books of accounts and hence find it difficult to get classified as MSMEs as per the current definition.5
The investment-based classification incentivises promoters to keep the investment size restricted to retain the benefits associated with the micro or small category.7
Turnover: The 2018 Bill sought to replace the investment criteria with annual turnover as the sole criteria for the classification of MSMEs. The Standing Committee agreed with the proposal under the Bill to use annual turnover as the criteria instead of investment.7 It observed that this could overcome some of the shortcomings of classification based on investment. While turnover based criteria will also require verification, the Committee noted that the GST Network (GSTN) data can act as a reliable source of information for this purpose. However, it also observed that:7
With turnover as a criterion for classification, corporates may misuse the incentives meant for MSMEs. For instance, there is a possibility that a multi-national company may produce a large quantity of products worth a high turnover and then market it through various subsidiaries registered as Micro or Small enterprise under GSTN.
The turnover of some enterprises may fluctuate depending on their business, which may result in the change of classification of the enterprise during a year.
The Committee noted that there is a wide gap in turnover limits. For instance, an enterprise with a turnover of Rs 6 crore and an enterprise with a turnover of Rs 75 crore (as proposed in 2018 Bill) would both be classified as a small enterprise, which seems incongruous.
The Expert Committee (RBI) also recommended using annual turnover as the criteria for classification instead of investment.5 It observed that turnover based definition would be transparent, progressive, and easier to implement through the GSTN. It also recommended that the power to change the definition of MSMEs should be delegated to the executive as it will help in responding to changing economic scenarios.
Number of employees: The Standing Committee had highlighted that in a labour-intensive country like India, appropriate focus is required on employment generation and MSME sector is the most suitable platform for this.7 It had recommended that the central government should assess the number of persons employed in the MSME sector and also consider employment as a criterion while classifying MSMEs. However, the Expert Committee (RBI) stated that while the employment-based definition is an additional feature preferred in some countries, the definition would pose challenges in implementation.5 According to the Ministry of MSME, employment as a criterion has problems due to: (i) factors such as seasonality and informal nature of engagement, (ii) similar to investment criteria, this would also require physical verification and has associated cost overheads.7
Number of MSMEs
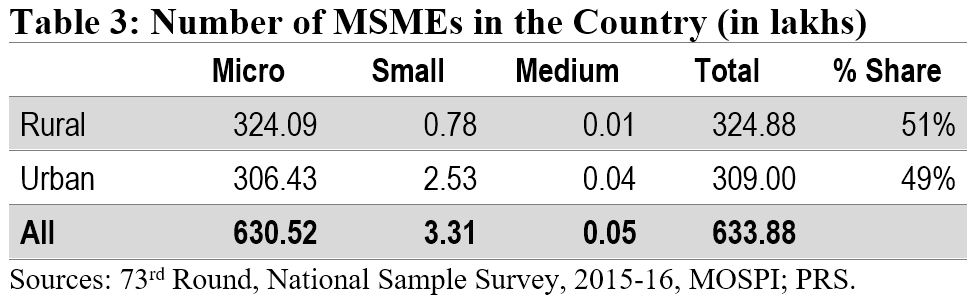
According to the National Sample Survey (2015-16), there were around 6.34 crore MSMEs in the country. The micro sector with 6.3 crore enterprises accounted for more than 99% of the total estimated number of MSMEs. The small and medium sectors accounted for only 0.52% and 0.01% of the estimated number of enterprises, respectively. Another dataset to understand the distribution of MSMEs is Udyog Aadhaar, a unique identity provided by the Unique Identification Authority of India (UIDAI) to MSME enterprises.[8] Udyog Aadhaar registration is based on self-declaration by enterprises. Between September 2015 and June 2020, 98.6 lakh enterprises have registered with UIDAI. According to this dataset, micro, small, and medium enterprises comprise 87.7%, 11.8% and 0.5% of the MSME sector respectively.
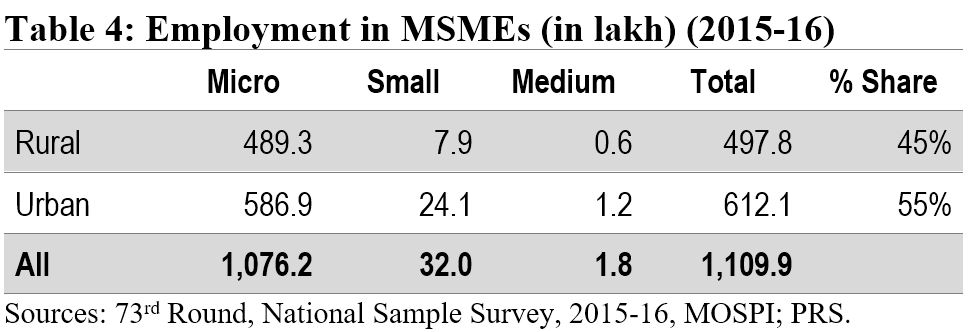
Employment in the MSME sector
The MSME sector employed nearly 11.1 crore people in 2015-16. The sector was the second largest employer after the agriculture sector. The highest number of employed persons were engaged in trade activity (35%), followed by persons engaged in manufacturing (32%).
Implications of change in the definition of MSMEs
The change in the definition of MSMEs may result in many enterprises which are currently classified as Small enterprises be reclassified as Micro, and those classified as Medium enterprises be reclassified as Small. Further, there may be many enterprises which are not currently classified as MSMEs, which may fall under the MSME classification as per the new definition. Such enterprises will also now benefit from the schemes related to MSMEs. The Ministry of MSME runs various schemes to provide for: (i) flow of credit to MSMEs, (ii) support for technology upgrade and modernisation, (iii) entrepreneurship and skill development, and (iv) cluster-wise measures to promote capacity-building and empowerment of MSME units. For instance, under the Credit Guarantee Fund Scheme for Micro and Small Enterprises, a credit guarantee cover of up to 75% of the credit is provided to micro and small enterprises.[9] Thus, the re-classification may require a significant increase in budgetary allocation for the MSME sector.
Other announcements related to MSMEs in the aftermath of COVID-19
MSME sector accounted for nearly 33.4% of the total manufacturing output in 2017-18.[10] During the same year, its share in the country’s total exports was around 49%. Between 2015 and 2017, the contribution of the sector in GDP has been around 30%. Due to the national lockdown induced by COVID-19, businesses including MSMEs have been badly hit. To provide immediate relief to the MSME sector, the government announced several measures in May 2020.[11] These include: (i) collateral-free loans for MSMEs with up to Rs 25 crore outstanding and up to Rs 100 crore turnover, (ii) Rs 20,000 crore as subordinate debt for stressed MSMEs, and (iii) Rs 50,000 crore of capital infusion into MSMEs. These measures have also been approved by the Union Cabinet.[12]
For more details on the announcements made under the Aatma Nirbhar Bharat Abhiyan, see here.
[1] “Cabinet approves Upward revision of MSME definition and modalities/ road map for implementing remaining two Packages for MSMEs (a)Rs 20000 crore package for Distressed MSMEs and (b) Rs 50,000 crore equity infusion through Fund of Funds”, Press Information Bureau, Cabinet Committee on Economic Affairs, June 1, 2020.
[2] The Micro, Small and Medium Enterprises Development Act, 2006, https://samadhaan.msme.gov.in/WriteReadData/DocumentFile/MSMED2006act.pdf.
[3] The Micro, Small and Medium Enterprises Development (Amendment) Bill, 2015, https://www.prsindia.org/sites/default/files/bill_files/MSME_bill%2C_2015_0.pdf.
[4] The Micro, Small and Medium Enterprises Development (Amendment) Bill, 2018, https://www.prsindia.org/sites/default/files/bill_files/The%20Micro%2C%20Small%20and%20Medium%20Enterprises%20Development%20%28Amendment%29%20Bill%2C%202018%20Bill%20Text.pdf.
[5] Report of the Expert Committee on Micro, Small and Medium Enterprises, The Reserve Bank of India, July 2019, https://rbidocs.rbi.org.in/rdocs/PublicationReport/Pdfs/MSMES24062019465CF8CB30594AC29A7A010E8A2A034C.PDF.
[6] MSME Country Indicators 2014, International Finance Corporation, December 2014, https://www.smefinanceforum.org/sites/default/files/analysis%20note.pdf.
[7] 294th Report on Micro Small and Medium Enterprises Development (Amendment) Bill 2018, Standing Committee on Industry, Rajya Sabha, December 2018, https://rajyasabha.nic.in/rsnew/Committee_site/Committee_File/ReportFile/17/111/294_2019_3_15.pdf.
[8] Enterprises with Udyog Aadhaar Number, National Portal for Registration of Micro, Small & Medium Enterprises, Ministry of Micro, Small and Medium Enterprises, https://udyogaadhaar.gov.in/UA/Reports/StateBasedReport_R3.aspx.
[9] Credit Guarantee Fund Scheme for Micro and Small Enterprises, Ministry of Micro, Small and Medium Enterprises, http://www.dcmsme.gov.in/schemes/sccrguarn.htm.
[10] Annual Report 2018-19, Ministry of Micro, Small and Medium Enterprises, https://msme.gov.in/sites/default/files/Annualrprt.pdf.
[11] "Finance Minister announce measures for relief and credit support related to businesses, especially MSMEs to support Indian Economy’s fight against COVID-19", Press Information Bureau, Ministry of Finance, May 13, 2020.
[12] "Cabinet approves additional funding of up to Rupees three lakh crore through introduction of Emergency Credit Line Guarantee Scheme (ECLGS)", Press Information Bureau, Ministry of Finance, May 20, 2020.
The Union Cabinet recently approved the launch of the National Health Protection Mission which was announced during Budget 2018-19. The Mission aims to provide a cover of five lakh rupees per family per year to about 10.7 crore families belonging to poor and vulnerable population. The insurance coverage is targeted for hospitalisation at the secondary and tertiary health care levels. This post explains the healthcare financing scenario in India, which is distributed across the centre, states, and individuals.
How much does India spend on health care financing vis-à-vis other countries?
The public health expenditure in India (total of centre and state governments) has remained constant at approximately 1.3% of the GDP between 2008 and 2015, and increased marginally to 1.4% in 2016-17. This is less than the world average of 6%. Note that the National Health Policy, 2017 proposes to increase this to 2.5% of GDP by 2025.
Including the private sector, the total health expenditure as a percentage of GDP is estimated at 3.9%. Out of the total expenditure, effectively about one-third (30%) is contributed by the public sector. This contribution is low as compared to other developing and developed countries. Examples include Brazil (46%), China (56%), Indonesia (39%), USA (48%), and UK (83%) (see Figure 1).

Who pays for healthcare in India? Mostly, it is the consumer out of his own pocket.
Given the public-private split of health care expenditure, it is quite clear that it is the private expenditure which dominates i.e. the individual consumer who bears the cost of her own healthcare. Let’s look at a further disaggregation of public spending and private spending to understand this.
In 2018-19, the Ministry of Health and Family Welfare received an allocation of Rs 54,600 crore(an increase of 2% over 2017-18). The National Health Mission (NHM) received the highest allocation at Rs 30,130 crore and constitutes 55% of the total Ministry allocation (see Table 1). Despite a higher allocation, NHM has seen a decline in the allocation vis-à-vis 2017-18.
Interestingly, in 2017-18, expenditure on NHM is expected to be Rs 4,000 crore more than what had been estimated earlier. This may indicate a greater capacity to spend than what was earlier allocated. A similar trend is exhibited at the overall Ministry level where the utilisation of the allocated funds has been over 100% in the last three years.
 State level spending
A NITI Aayog report (2017) noted that low income states with low revenue capacity spend significant lower on social services like health. Further, differences in the cost of delivering health services have contributed to health disparities among and within states.
Following the 14th Finance Commission recommendations, there has been an increase in the states’ share in central pool of taxes and they were given greater autonomy and flexibility to spend according to their priorities. Despite the enhanced share of states in central taxes, the increase in health budgets by some states has been marginal (see Figure 2).
 Consumer level spending
If cumulatively 30% of the total health expenditure is incurred by the public sector, the rest of the health expenditure, i.e. approximately 70% is borne by consumers. Household health expenditures include out of pocket expenditures (95%) and insurance (5%). Out of pocket expenditure dominate and these are the payments made directly by individuals at the point of services which are not covered under any financial protection scheme. The highest percentage of out of pocket health expenditure (52%) is made towards medicines (see Figure 3).

This is followed by private hospitals (22%), medical and diagnostic labs (10%), and patient transportation, and emergency rescue (6%). Out of pocket expenditure is typically financed by household revenues (71%) (see Figure 4).

Note that 86% of rural population and 82% of urban population are not covered under any scheme of health expenditure support. Due to high out of pocket healthcare expenditure, about 7% population is pushed below the poverty threshold every year.
Out of the total number of persons covered under health insurance in India, three-fourths are covered under government sponsored health schemes and the balance one-fourth are covered by private insurers. With respect to the government sponsored health insurance, more claims have been made in comparison to the premiums collected, i.e., the returns to the government have been negative.
It is in this context that the newly proposed National Health Protection Mission will be implemented. First, the scheme seeks to provide coverage for hospitalisation at the secondary and tertiary levels of healthcare. The High Level Expert Group set up by the Planning Commission (2011) recommended that the focus of healthcare provision in the country should be towards providing primary health care. It observed that focus on prevention and early management of health problems can reduce the need for complicated specialist care provided at the tertiary level. Note that depending on the level of care required, health institutions in India are broadly classified into three types: primary care (provided at primary health centres), secondary care (provided at district hospitals), and tertiary care institutions (provided at specialised hospitals like AIIMS).
Second, the focus of the Mission seems to be on hospitalisation (including pre and post hospitalisation charges). However, most of the out of the pocket expenditure made by consumers is actually on buying medicines (52%) as seen in Figure 3. Further, these purchases are mostly made for patients who do not need hospitalisation.

