On June 1, 2020, the Cabinet Committee on Economic Affairs approved a revision in the definition of Micro, Small and Medium Enterprises (MSMEs).[1] In this blog, we discuss the change in the definition as approved by the Cabinet, and examine some of the common criteria used for classification of MSMEs.
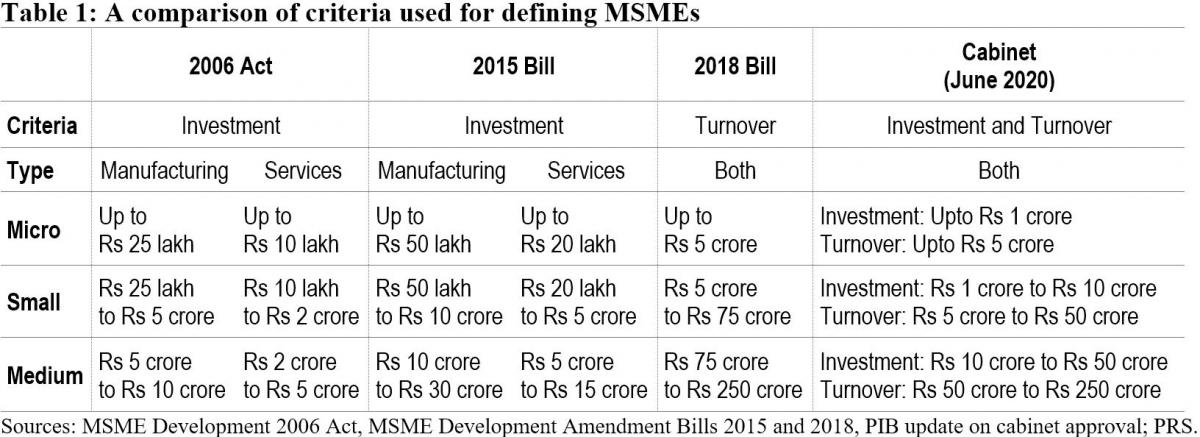
Currently, MSMEs are defined under the Micro, Small and Medium Enterprises Development Act, 2006.[2] The Act classifies them as micro, small and medium enterprises based on: (i) investment in plant and machinery for enterprises engaged in manufacturing or production of goods, and (ii) investment in equipment for enterprises providing services. As per the Cabinet approval, the investment limits will be revised upwards and annual turnover of the enterprise will be used as additional criteria for the classification of MSMEs (Table 1).
Earlier attempts to amend the definition of MSMEs
The central government has sought to revise the definition of MSMEs in the Act on two earlier occasions. The government introduced the MSME Development (Amendment) Bill, 2015 which proposed to increase the investment limits for manufacturing and services MSMEs.[3] This Bill was withdrawn in July 2018 and another Bill was introduced. The MSME Development (Amendment) Bill, 2018 proposed to: (i) use annual turnover as criteria instead of investment for classification of MSMEs, (ii) remove the distinction between manufacturing and services, and (iii) provide the central government with the power to revise the turnover limits, through a notification.[4] The 2018 Bill lapsed with the dissolution of 16th Lok Sabha.
Global trends in criteria for the classification of MSMEs
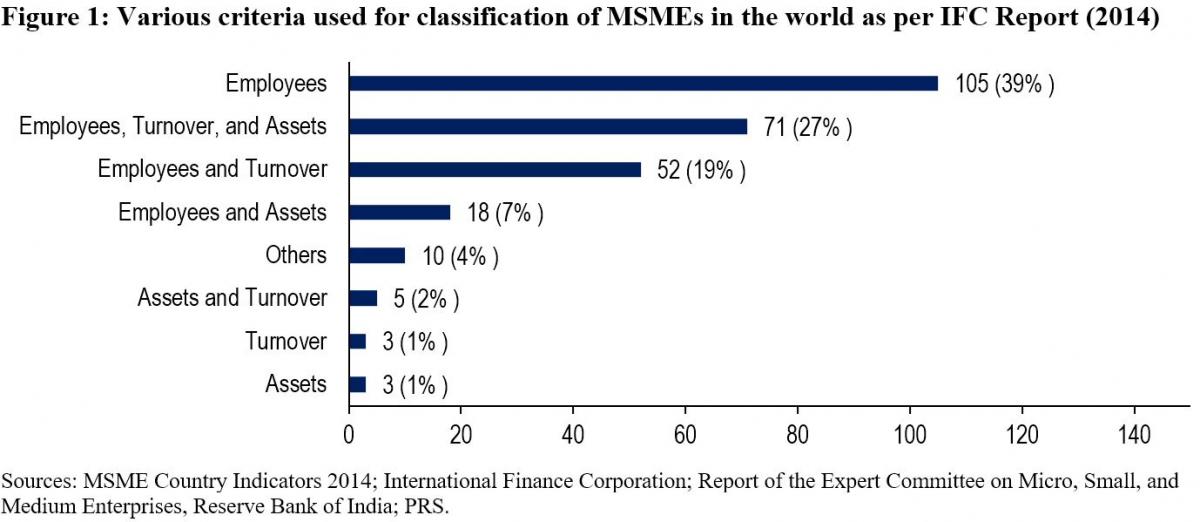
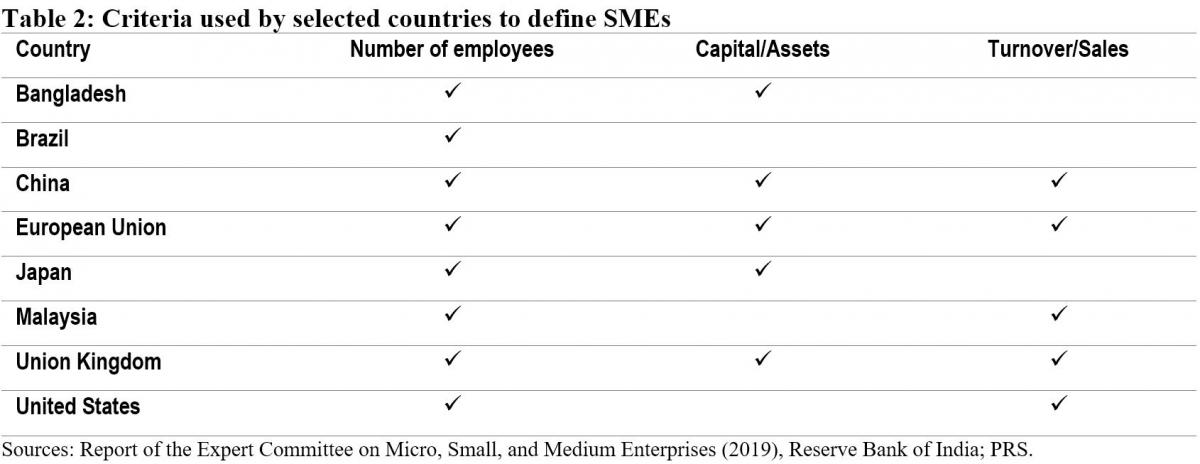
While India will now be using investment and annual turnover as the criteria to classify MSMEs, globally, the number of employees is the most widely used criteria for classifying MSMEs. The Reserve Bank of India's Expert Committee on MSMEs (2019) cited a study by the International Finance Corporation in 2014 which analysed 267 definitions used by different institutions in 155 countries.[5],[6] According to the study, countries used a combination of criteria to classify MSMEs. 92% of the definitions used the number of employees as one of the criteria. Other frequently used criteria were: (i) turnover (49%), and (ii) value of assets (36%). 11% of the analysed definitions used alternative criteria such as: (i) loan size, (ii) years of experience, and (iii) initial investment.
Evaluation of common criteria used to define MSMEs
Investment: The 2006 Act uses investment in plant, machinery, and equipment to classify MSMEs. Some of the issues with the investment criteria include:
Due to their informal and small scale of operations, firms often do not maintain proper books of accounts and hence find it difficult to get classified as MSMEs as per the current definition.5
The investment-based classification incentivises promoters to keep the investment size restricted to retain the benefits associated with the micro or small category.7
Turnover: The 2018 Bill sought to replace the investment criteria with annual turnover as the sole criteria for the classification of MSMEs. The Standing Committee agreed with the proposal under the Bill to use annual turnover as the criteria instead of investment.7 It observed that this could overcome some of the shortcomings of classification based on investment. While turnover based criteria will also require verification, the Committee noted that the GST Network (GSTN) data can act as a reliable source of information for this purpose. However, it also observed that:7
With turnover as a criterion for classification, corporates may misuse the incentives meant for MSMEs. For instance, there is a possibility that a multi-national company may produce a large quantity of products worth a high turnover and then market it through various subsidiaries registered as Micro or Small enterprise under GSTN.
The turnover of some enterprises may fluctuate depending on their business, which may result in the change of classification of the enterprise during a year.
The Committee noted that there is a wide gap in turnover limits. For instance, an enterprise with a turnover of Rs 6 crore and an enterprise with a turnover of Rs 75 crore (as proposed in 2018 Bill) would both be classified as a small enterprise, which seems incongruous.
The Expert Committee (RBI) also recommended using annual turnover as the criteria for classification instead of investment.5 It observed that turnover based definition would be transparent, progressive, and easier to implement through the GSTN. It also recommended that the power to change the definition of MSMEs should be delegated to the executive as it will help in responding to changing economic scenarios.
Number of employees: The Standing Committee had highlighted that in a labour-intensive country like India, appropriate focus is required on employment generation and MSME sector is the most suitable platform for this.7 It had recommended that the central government should assess the number of persons employed in the MSME sector and also consider employment as a criterion while classifying MSMEs. However, the Expert Committee (RBI) stated that while the employment-based definition is an additional feature preferred in some countries, the definition would pose challenges in implementation.5 According to the Ministry of MSME, employment as a criterion has problems due to: (i) factors such as seasonality and informal nature of engagement, (ii) similar to investment criteria, this would also require physical verification and has associated cost overheads.7
Number of MSMEs
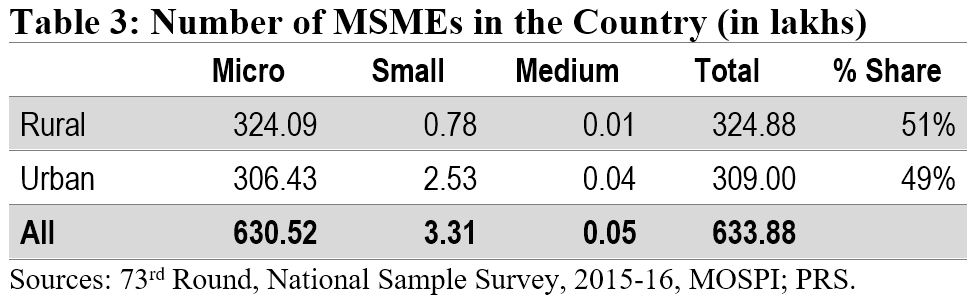
According to the National Sample Survey (2015-16), there were around 6.34 crore MSMEs in the country. The micro sector with 6.3 crore enterprises accounted for more than 99% of the total estimated number of MSMEs. The small and medium sectors accounted for only 0.52% and 0.01% of the estimated number of enterprises, respectively. Another dataset to understand the distribution of MSMEs is Udyog Aadhaar, a unique identity provided by the Unique Identification Authority of India (UIDAI) to MSME enterprises.[8] Udyog Aadhaar registration is based on self-declaration by enterprises. Between September 2015 and June 2020, 98.6 lakh enterprises have registered with UIDAI. According to this dataset, micro, small, and medium enterprises comprise 87.7%, 11.8% and 0.5% of the MSME sector respectively.
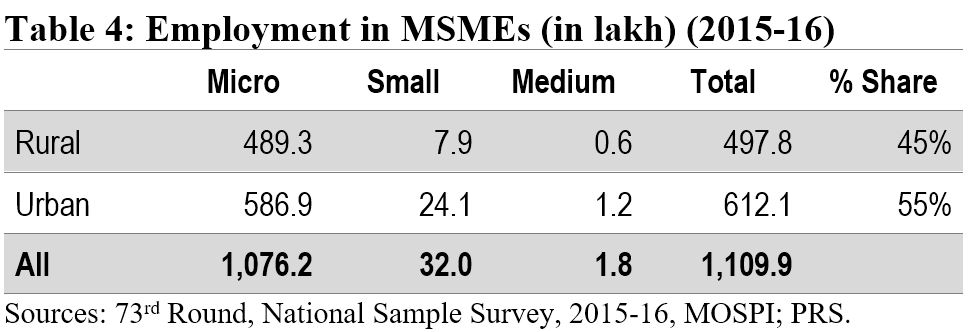
Employment in the MSME sector
The MSME sector employed nearly 11.1 crore people in 2015-16. The sector was the second largest employer after the agriculture sector. The highest number of employed persons were engaged in trade activity (35%), followed by persons engaged in manufacturing (32%).
Implications of change in the definition of MSMEs
The change in the definition of MSMEs may result in many enterprises which are currently classified as Small enterprises be reclassified as Micro, and those classified as Medium enterprises be reclassified as Small. Further, there may be many enterprises which are not currently classified as MSMEs, which may fall under the MSME classification as per the new definition. Such enterprises will also now benefit from the schemes related to MSMEs. The Ministry of MSME runs various schemes to provide for: (i) flow of credit to MSMEs, (ii) support for technology upgrade and modernisation, (iii) entrepreneurship and skill development, and (iv) cluster-wise measures to promote capacity-building and empowerment of MSME units. For instance, under the Credit Guarantee Fund Scheme for Micro and Small Enterprises, a credit guarantee cover of up to 75% of the credit is provided to micro and small enterprises.[9] Thus, the re-classification may require a significant increase in budgetary allocation for the MSME sector.
Other announcements related to MSMEs in the aftermath of COVID-19
MSME sector accounted for nearly 33.4% of the total manufacturing output in 2017-18.[10] During the same year, its share in the country’s total exports was around 49%. Between 2015 and 2017, the contribution of the sector in GDP has been around 30%. Due to the national lockdown induced by COVID-19, businesses including MSMEs have been badly hit. To provide immediate relief to the MSME sector, the government announced several measures in May 2020.[11] These include: (i) collateral-free loans for MSMEs with up to Rs 25 crore outstanding and up to Rs 100 crore turnover, (ii) Rs 20,000 crore as subordinate debt for stressed MSMEs, and (iii) Rs 50,000 crore of capital infusion into MSMEs. These measures have also been approved by the Union Cabinet.[12]
For more details on the announcements made under the Aatma Nirbhar Bharat Abhiyan, see here.
[1] “Cabinet approves Upward revision of MSME definition and modalities/ road map for implementing remaining two Packages for MSMEs (a)Rs 20000 crore package for Distressed MSMEs and (b) Rs 50,000 crore equity infusion through Fund of Funds”, Press Information Bureau, Cabinet Committee on Economic Affairs, June 1, 2020.
[2] The Micro, Small and Medium Enterprises Development Act, 2006, https://samadhaan.msme.gov.in/WriteReadData/DocumentFile/MSMED2006act.pdf.
[3] The Micro, Small and Medium Enterprises Development (Amendment) Bill, 2015, https://www.prsindia.org/sites/default/files/bill_files/MSME_bill%2C_2015_0.pdf.
[4] The Micro, Small and Medium Enterprises Development (Amendment) Bill, 2018, https://www.prsindia.org/sites/default/files/bill_files/The%20Micro%2C%20Small%20and%20Medium%20Enterprises%20Development%20%28Amendment%29%20Bill%2C%202018%20Bill%20Text.pdf.
[5] Report of the Expert Committee on Micro, Small and Medium Enterprises, The Reserve Bank of India, July 2019, https://rbidocs.rbi.org.in/rdocs/PublicationReport/Pdfs/MSMES24062019465CF8CB30594AC29A7A010E8A2A034C.PDF.
[6] MSME Country Indicators 2014, International Finance Corporation, December 2014, https://www.smefinanceforum.org/sites/default/files/analysis%20note.pdf.
[7] 294th Report on Micro Small and Medium Enterprises Development (Amendment) Bill 2018, Standing Committee on Industry, Rajya Sabha, December 2018, https://rajyasabha.nic.in/rsnew/Committee_site/Committee_File/ReportFile/17/111/294_2019_3_15.pdf.
[8] Enterprises with Udyog Aadhaar Number, National Portal for Registration of Micro, Small & Medium Enterprises, Ministry of Micro, Small and Medium Enterprises, https://udyogaadhaar.gov.in/UA/Reports/StateBasedReport_R3.aspx.
[9] Credit Guarantee Fund Scheme for Micro and Small Enterprises, Ministry of Micro, Small and Medium Enterprises, http://www.dcmsme.gov.in/schemes/sccrguarn.htm.
[10] Annual Report 2018-19, Ministry of Micro, Small and Medium Enterprises, https://msme.gov.in/sites/default/files/Annualrprt.pdf.
[11] "Finance Minister announce measures for relief and credit support related to businesses, especially MSMEs to support Indian Economy’s fight against COVID-19", Press Information Bureau, Ministry of Finance, May 13, 2020.
[12] "Cabinet approves additional funding of up to Rupees three lakh crore through introduction of Emergency Credit Line Guarantee Scheme (ECLGS)", Press Information Bureau, Ministry of Finance, May 20, 2020.
The Finance Minister, Ms. Nirmala Sitharaman, presented the Union Budget for the financial year 2019-20 in Parliament on July 5, 2019. In the 2019-20 budget, the government presented the estimates of its expenditure and receipts for the year 2019-20. The budget also gave an account of how much money the government raised or spent in 2017-18. In addition, the budget also presented the revised estimates made by the government for the year 2018-19 in comparison to the estimates it had given to Parliament in the previous year’s budget.
What are revised estimates?
Some of the estimates made by the government might change during the course of the year. For instance, once the year gets underway, some ministries may need more funds than what was actually allocated to them in the budget, or the receipts expected from certain sources might change. Such deviations from the budget estimates get reflected in the figures released by the government at later stages as part of the subsequent budgets. Once the year ends, the actual numbers are audited by the Comptroller and Auditor General of India (CAG), post which they are presented to Parliament with the upcoming budget, i.e. two years after the estimates are made.
For instance, estimates for the year 2018-19 were presented as part of the 2018-19 budget in February 2018. In the 2019-20 interim budget presented in February 2019 (10 months after the financial year 2018-19 got underway), the government revised these estimates based on the actual receipts and expenditure accounted so far during the year and incorporated estimates for the remaining two months.
The actual receipts and expenditure accounts of the central government are maintained by the Controller General of Accounts (CGA), Ministry of Finance on a monthly basis. In addition to the monthly accounts, the CGA also publishes the provisional unaudited figures for the financial year by the end of the month of May. Once these provisional figures are audited by the CAG, they are presented as actuals in next year’s budget. The CGA reported the figures for 2018-19 on May 31, 2019.[1] The Economic Survey 2018-19 presented on July 4, 2019 uses these figures.[2]
The budget presented on July 5 replicates the revised estimates reported as part of the interim budget (February 1, 2019). Thus, it did not take into account the updated figures for the year 2018-19 from the CGA.
Table 1 gives a comparison of the 2018-19 revised estimates presented by the central government in the budget with the provisional unaudited figures maintained by the CGA for the year 2018-19.[3]
Table 1: Budget at a Glance: Comparison of 2018-19 revised estimates with CGA figures (unaudited) (Rs crore)
|
Actuals |
Budgeted |
Revised |
Provisional |
Difference |
|
|
Revenue Expenditure |
18,78,833 |
21,41,772 |
21,40,612 |
20,08,463 |
-1,32,149 |
|
Capital Expenditure |
2,63,140 |
3,00,441 |
3,16,623 |
3,02,959 |
-13,664 |
|
Total Expenditure |
21,41,973 |
24,42,213 |
24,57,235 |
23,11,422 |
-1,45,813 |
|
Revenue Receipts |
14,35,233 |
17,25,738 |
17,29,682 |
15,63,170 |
-1,66,512 |
|
Capital Receipts |
1,15,678 |
92,199 |
93,155 |
1,02,885 |
9,730 |
|
of which: |
|
|
|
|
|
|
Recoveries of Loans |
15,633 |
12,199 |
13,155 |
17,840 |
4,685 |
|
Other receipts (including disinvestments) |
1,00,045 |
80,000 |
80,000 |
85,045 |
5,045 |
|
Total Receipts (without borrowings) |
15,50,911 |
18,17,937 |
18,22,837 |
16,66,055 |
-1,56,782 |
|
Revenue Deficit |
4,43,600 |
4,16,034 |
4,10,930 |
4,45,293 |
34,363 |
|
% of GDP |
2.6 |
2.2 |
2.2 |
2.4 |
|
|
Fiscal Deficit |
5,91,062 |
6,24,276 |
6,34,398 |
6,45,367 |
10,969 |
|
% of GDP |
3.5 |
3.3 |
3.4 |
3.4 |
|
|
Primary Deficit |
62,110 |
48,481 |
46,828 |
62,692 |
15,864 |
|
% of GDP |
0.4 |
0.3 |
0.2 |
0.3 |
|
Sources: Budget at a Glance, Union Budget 2019-20; Controller General of Accounts, Ministry of Finance; PRS.
The 2018-19 provisional figures for revenue receipts is Rs 15,63,170 crore, which is Rs 1,66,512 crore less than the revised estimates. This is largely due to Rs 1,67,455 crore shortfall in centre’s net tax revenue between the revised estimates and the provisional estimates (Table 2).
Major taxes which see a shortfall between the gross tax revenue presented in the revised estimates vis-à-vis the provisional figures are income tax (Rs 67,346 crore) and GST (Rs 59,930 crore). Non-tax revenue and disinvestment receipts as per the provisional figures are higher than the revised estimates.
Table 2: Break up of central government receipts: Comparison of 2018-19 RE with CGA figures (unaudited) (Rs crore)
|
|
Actuals |
Budgeted |
Revised |
Provisional |
Difference |
|
Gross Tax Revenue |
19,19,009 |
22,71,242 |
22,48,175 |
20,80,203 |
-1,67,972 |
|
of which: |
|
|
|
|
|
|
Corporation Tax |
5,71,202 |
6,21,000 |
6,71,000 |
6,63,572 |
-7,428 |
|
Taxes on Income |
4,30,772 |
5,29,000 |
5,29,000 |
4,61,654 |
-67,346 |
|
Goods and Services Tax |
4,42,562 |
7,43,900 |
6,43,900 |
5,83,970 |
-59,930 |
|
Customs |
1,29,030 |
1,12,500 |
1,30,038 |
1,17,930 |
-12,108 |
|
Union Excise Duties |
2,59,431 |
2,59,600 |
2,59,612 |
2,30,998 |
-28,614 |
|
A. Centre's Net Tax Revenue |
12,42,488 |
14,80,649 |
14,84,406 |
13,16,951 |
-1,67,455 |
|
B. Non Tax Revenue |
1,92,745 |
2,45,089 |
2,45,276 |
2,46,219 |
943 |
|
of which: |
|
|
|
|
|
|
Interest Receipts |
13,574 |
15,162 |
12,047 |
12,815 |
768 |
|
Dividend and Profits |
91,361 |
1,07,312 |
1,19,264 |
1,13,424 |
-5,840 |
|
Other Non-Tax Revenue |
87,810 |
1,22,615 |
1,13,965 |
1,19,980 |
6,015 |
|
C. Capital Receipts (without borrowings) |
1,15,678 |
92,199 |
93,155 |
1,02,885 |
9,730 |
|
of which: |
|
|
|
|
|
|
Disinvestment |
1,00,045 |
80,000 |
80,000 |
85,045 |
5,045 |
|
Receipts (without borrowings) (A+B+C) |
15,50,911 |
18,17,937 |
18,22,837 |
16,66,055 |
-1,56,782 |
|
Borrowings |
5,91,062 |
6,24,276 |
6,34,398 |
6,45,367 |
10,969 |
|
Total Receipts (including borrowings) |
21,41,973 |
24,42,213 |
24,57,235 |
23,11,422 |
-1,45,813 |
Note: Centre’s net tax revenue is gross tax revenue less share of states in central taxes. Figures for GST include receipts from the GST compensation cess. Note that GST was levied for a nine-month period during the year 2017-18, starting July 2017.
Sources: Receipts Budget, Union Budget 2019-20; Controller General of Accounts, Ministry of Finance; PRS.
While the provisional figures show a considerable decrease in receipts (Rs 1,56,782 crore) as compared to the revised estimates, fiscal deficit has not shown a comparable increase. Fiscal deficit is estimated to be Rs 10,969 crore higher than the revised estimates as per the provisional accounts.
On the expenditure side, the total expenditure as per the provisional figures show a decrease of Rs 1,45,813 crore as compared to the revised estimates. Certain Ministries and expenditure items have seen a decrease in expenditure as compared to the revised estimates made by the government. As per the provisional accounts, the expenditure of the Ministry of Agriculture and Farmers’ Welfare and the Ministry of Consumer Affairs, Food and Public Distribution are Rs 22,133 crore and Rs 70,712 crore lower than the revised estimates, respectively. The decrease in the Ministries’ expenditure as a percentage of the revised estimates are 29% and 39%, respectively. The food subsidy according to CGA was Rs 1,01,904 crore, which was Rs 69,394 crore lower than the revised estimates for the year 2018-19 given in the budget documents.
[1] “Accounts of the Union Government of India (Provisional/Unaudited) for the Financial Year 2018-19”, Press Information Bureau, Ministry of Finance, May 31, 2019.
[2] Fiscal Developments, Economic Survey 2018-19, https://www.indiabudget.gov.in/economicsurvey/doc/vol2chapter/echap02_vol2.pdf.
[3] Controller General of Accounts, Ministry of Finance, March 2018-19, http://www.cga.nic.in/MonthlyReport/Published/3/2018-2019.aspx.

