The United Nations celebrates October 16 as the World Food Day every year, with an aim to spread awareness about eradicating hunger and ensuring food security for all.[1] In this context, we examine the status of food and public distribution in India, and some challenges in ensuring food security for all.
Background
In 2017-18, over Rs 1,50,000 crore, or 7.6% of the government’s total expenditure has been allocated for providing food subsidy under the Targeted Public Distribution System (TPDS).[2] This allocation is made to the Department of Food and Public Distribution under the Ministry of Consumer Affairs.
Food subsidy has been the largest component of the Department’s expenditure (94% in 2017-18), and has increased six-fold over the past 10 years. This subsidy is used for the implementation of the National Food Security Act, 2013 (NFSA), which provides subsidised food grains (wheat and rice) to 80 crore people in the country.[3] The NFSA seeks to ensure improved nutritional intake for people in the country.3
One of the reasons for the six-fold increase in food subsidy is the non-revision of the price at which food grains are given to beneficiaries since 2002.[4] For example, rice is given to families under the Antyodaya Anna Yojana at Rs 3/Kg since 2002, while the cost of providing this has increased from Rs 11/Kg in 2001-02 to Rs 33/Kg in 2017-18.
Provision of food subsidy
TPDS provides food security to people below the poverty line. Over the years, the expenditure on food subsidy has increased, while the ratio of people below poverty line has reduced. A similar trend can also be seen in the proportion of undernourished persons in India, which reduced from 24% in 1990 to 15% in 2014 (see Table 1). These trends may indicate that the share of people needing subsidised food has declined.
Nutritional balance: The NFSA guarantees food grains i.e. wheat and rice to beneficiaries, to ensure nutritious food intake.3 Over the last two decades, the share of cereals or food grains as a percentage of food consumption has reduced from 13% to 8% in the country, whereas that of milk, eggs, fish and meat has increased (see Figure 1). This indicates a reduced preference for wheat and rice, and a rise in preference towards other protein rich food items. 
Methods of providing food subsidy
Food subsidy is provided majorly using two methods. We discuss these in detail below.
TPDS assures beneficiaries that they will receive food grains, and insulates them against price volatility. Food grains are delivered through fair price shops in villages, which are easy to access.[5],[6]
However, high leakages have been observed in the system, both during transportation and distribution. These include pilferage and errors of inclusion and exclusion from the beneficiary list. In addition, it has also been argued that the distribution of wheat and rice may cause an imbalance in the nutritional intake as discussed earlier.7 Beneficiaries have also reported receiving poor quality food grains as part of the system.
Cash Transfers seek to increase the choices available with a beneficiary, and provide financial assistance. It has been argued that the costs of DBT may be lesser than TPDS, owing to lesser costs incurred on transport and storage. These transfers may also be undertaken electronically.6,7
However, it has also been argued that cash received as part of DBT may be spent on non-food items. Such a system may also expose beneficiaries to inflation. In this regard, one may also consider the low penetration and access to banking in rural areas.[7]

In 2017-18, 52% of the centre’s total subsidy expenditure will be on providing food subsidy under TPDS (see Figure 2). The NFSA states that the centre and states should introduce schemes for cash transfers to beneficiaries. Other experts have also suggested replacing TPDS with a Direct Benefit Transfer (DBT) system.4,[8]
The central government introduced cash subsidy to TPDS beneficiaries in September 2015.[9] As of March 2016, this was being implemented on a pilot basis in a few union territories. In 2015, a Committee on Restructuring of Food Corporation of India had also recommended introducing Aadhaar to plug leakages in PDS, and indexing it to inflation. The Committee estimated that a switch to DBT would reduce the food subsidy bill of the government by more than Rs 30,000 crore.[10]
Current challenges in PDS
Leakages in PDS: Leakages refer to food grains not reaching intended beneficiaries. According to 2011 data, leakages in PDS were estimated to be 46.7%.10,[11] Leakages may be of three types: (i) pilferage during transportation of food grains, (ii) diversion at fair price shops to non-beneficiaries, and (iii) exclusion of entitled beneficiaries from the list.6,[12]
In 2016, the Comptroller and Auditor General (CAG) found that states had not completed the process of identifying beneficiaries, and 49% of the beneficiaries were yet to be identified. It also noted that inclusion and exclusion errors had been reported in the beneficiary lists.[13]
In February 2017, the Ministry made it mandatory for beneficiaries under NFSA to use Aadhaar as proof of identification for receiving food grains. Through this, the government aims to remove bogus ration cards, check leakages and ensure better delivery of food grains.10,[14] As of January 2017, while 100% ration cards had been digitised, the seeding of these cards with Aadhaar was at 73%.14

Storage: As of 2016-17, the total storage capacity in the country is 788 lakh tonnes, of which 354 lakh tonnes is with the Food Corporation of India and 424 lakh tonnes is with the state agencies.[15]
The CAG in its performance audit found that the available storage capacity in states was inadequate for the allocated quantity of food grains.13 For example, as of October 2015, of the 233 godowns sanctioned for construction in Maharashtra, only 93 had been completed. It also noted that in four of the last five years, the stock of food grains with the centre had been higher than the storage capacity available with Food Corporation of India.
Quality of food grains: A survey conducted in 2011 had noted that people complained about receiving poor quality food grain which had to be mixed with other grains to be edible.6 There have also been complaints about people receiving food grains containing alien substances such as pebbles. Poor quality of food may impact the willingness of people to buy food from fair price shops, and may have an adverse impact on their health.[16]
The Ministry has stated that while regular surveillance, monitoring, inspection and random sampling of all food items is under-taken by State Food Safety Officers, separate data for food grains distributed under PDS is unavailable.[17] In the absence of data with regard to quality testing results of food grains supplied under PDS, it may be difficult to ascertain whether these food items meet the prescribed quality and safety standards.
[1] About World Food Day, http://www.fao.org/world-food-day/2017/about/en/.
[2] Expenditure Budget, Union Budget 2017-18, http://unionbudget.nic.in/ub2017-18/eb/allsbe.pdf.
[3] National Food Security Act, 2013, http://indiacode.nic.in/acts-in-pdf/202013.pdf.
[4] “Prices, Agriculture and Food Management”, Chapter 5, Economic Survey 2015-16, http://unionbudget.nic.in/budget2016-2017/es2015-16/echapvol2-05.pdf.
[5] The Case for Direct Cash Transfers to the Poor, Economic and Political Weekly, April 2008, http://www.epw.in/system/files/pdf/2008_43/15/The_Case_for_Direct_Cash_Transfers_to_the_Poor.pdf.
[6] Revival of the Public Distribution System: Evidence and Explanations, The Economic and Political Weekly, November 5, 2011,
[7] ‘Report of the Internal Working Group on Branch Authorisation Policy’, Reserve Bank of India, September 2016, https://rbidocs.rbi.org.in/rdocs/PublicationReport/Pdfs/IWG99F12F147B6E4F8DBEE8CEBB8F09F103.PDF.
[8] Working Paper 294, “Leakages from Public Distribution System”, January 2015, ICRIER, http://icrier.org/pdf/Working_Paper_294.pdf.
[9] “The Cash Transfer of Food Subsidy Rules, 2015”, Ministry of Consumer Affairs, Food and Public Distribution, September 3, 2015, http://dfpd.nic.in/writereaddata/Portal/News/32_1_cash.pdf.
[10] Report of the High Level Committee on Reorienting the Role and Restructuring of Food Corporation of India, January 2015, http://www.fci.gov.in/app2/webroot/upload/News/Report%20of%20the%20High%20Level%20Committee%20on%20Reorienting%20the%20Role%20and%20Restructuring%20of%20FCI_English_1.pdf.
[11] Third Report of the Standing Committee on Food, Consumer Affairs and Public Distribution: Demands for Grants 2015-16, Department of Food and Public Distribution, http://164.100.47.193/lsscommittee/Food,%20Consumer%20Affairs%20&%20Public%20Distribution/16_Food_Consumer_Affairs_And_Public_Distribution_3.pdf.
[12] Performance Evaluation of Targeted Public Distribution System, Planning Commission of India, March 2005, http://planningcommission.nic.in/reports/peoreport/peo/peo_tpds.pdf.
[13] Audit on the Preparedness for Implementation of National Food Security Act, 2013 for the year ended March, 2015, Report No. 54 of 2015, Comptroller and Auditor General of India, http://cag.gov.in/sites/default/files/audit_report_files/Union_Civil_National_Food_Security_Report_54_of_2015.pdf.
[14] Unstarred Question No. 844, Lok Sabha, Ministry of Consumer Affairs, Food and Public Distribution, Answered on February 7, 2017, http://164.100.47.190/loksabhaquestions/annex/11/AU844.pdf.
[15] Annual Report 2016-17, Department of Food & Public Distribution, Ministry of Consumer Affairs, Food & Public Distribution, http://dfpd.nic.in/writereaddata/images/annual-140217.pdf.
[16] 30 Food Subsidy, The Economic and Political Weekly, December 27, 2014, http://www.epw.in/system/files/pdf/2014_49/52/Food_Subsidy.pdf.
[17] Unstarred Question No. 2124, Lok Sabha, Ministry of Consumer Affairs, Food and Public Distribution, Answered on November 29, 2016, http://164.100.47.190/loksabhaquestions/annex/10/AU2124.pdf.
On June 1, 2020, the Cabinet Committee on Economic Affairs approved a revision in the definition of Micro, Small and Medium Enterprises (MSMEs).[1] In this blog, we discuss the change in the definition as approved by the Cabinet, and examine some of the common criteria used for classification of MSMEs.
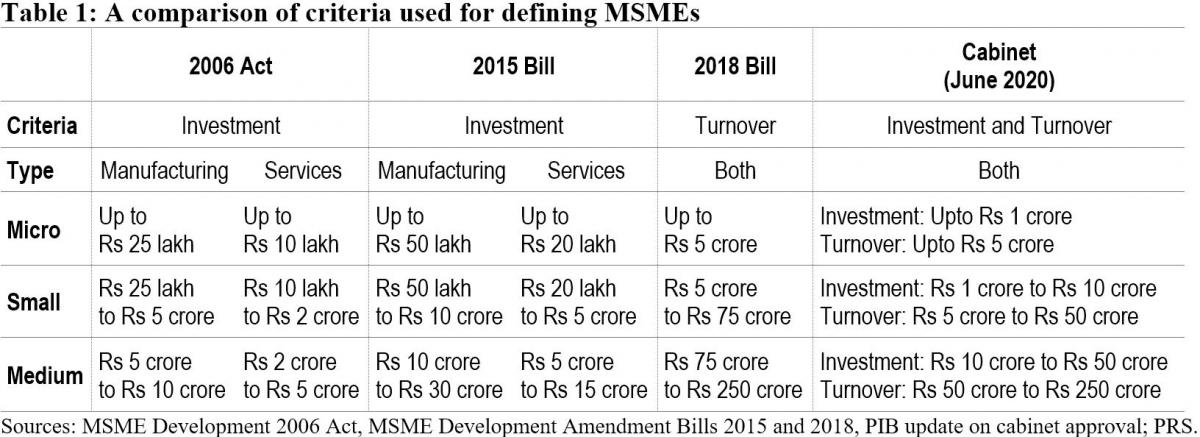
Currently, MSMEs are defined under the Micro, Small and Medium Enterprises Development Act, 2006.[2] The Act classifies them as micro, small and medium enterprises based on: (i) investment in plant and machinery for enterprises engaged in manufacturing or production of goods, and (ii) investment in equipment for enterprises providing services. As per the Cabinet approval, the investment limits will be revised upwards and annual turnover of the enterprise will be used as additional criteria for the classification of MSMEs (Table 1).
Earlier attempts to amend the definition of MSMEs
The central government has sought to revise the definition of MSMEs in the Act on two earlier occasions. The government introduced the MSME Development (Amendment) Bill, 2015 which proposed to increase the investment limits for manufacturing and services MSMEs.[3] This Bill was withdrawn in July 2018 and another Bill was introduced. The MSME Development (Amendment) Bill, 2018 proposed to: (i) use annual turnover as criteria instead of investment for classification of MSMEs, (ii) remove the distinction between manufacturing and services, and (iii) provide the central government with the power to revise the turnover limits, through a notification.[4] The 2018 Bill lapsed with the dissolution of 16th Lok Sabha.
Global trends in criteria for the classification of MSMEs
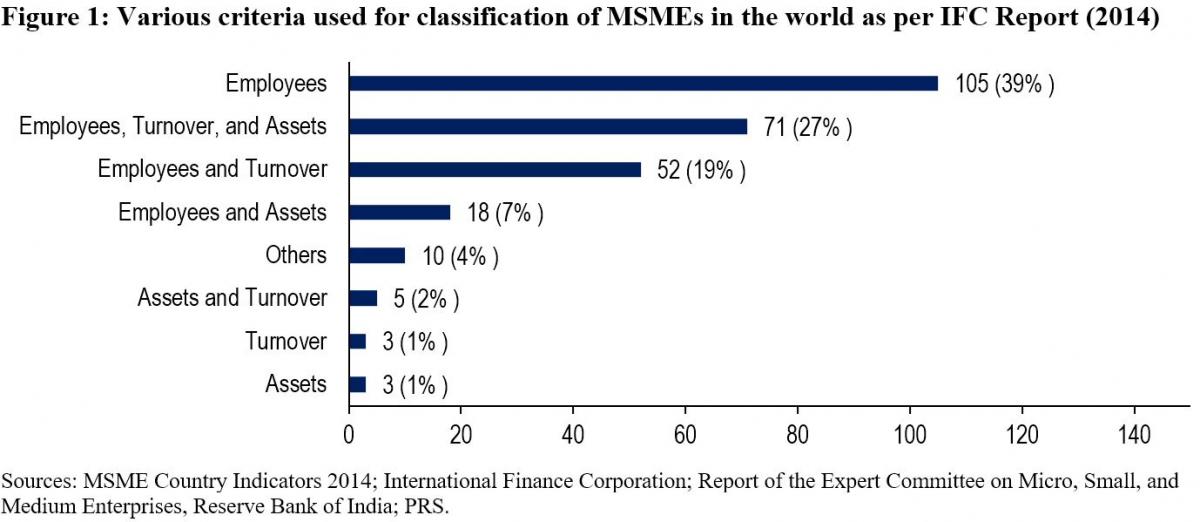
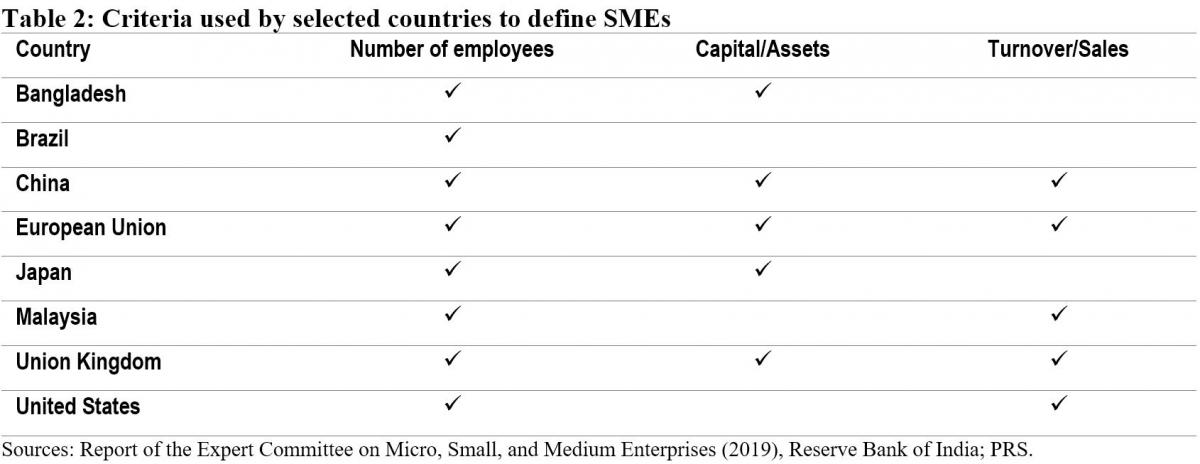
While India will now be using investment and annual turnover as the criteria to classify MSMEs, globally, the number of employees is the most widely used criteria for classifying MSMEs. The Reserve Bank of India's Expert Committee on MSMEs (2019) cited a study by the International Finance Corporation in 2014 which analysed 267 definitions used by different institutions in 155 countries.[5],[6] According to the study, countries used a combination of criteria to classify MSMEs. 92% of the definitions used the number of employees as one of the criteria. Other frequently used criteria were: (i) turnover (49%), and (ii) value of assets (36%). 11% of the analysed definitions used alternative criteria such as: (i) loan size, (ii) years of experience, and (iii) initial investment.
Evaluation of common criteria used to define MSMEs
Investment: The 2006 Act uses investment in plant, machinery, and equipment to classify MSMEs. Some of the issues with the investment criteria include:
Due to their informal and small scale of operations, firms often do not maintain proper books of accounts and hence find it difficult to get classified as MSMEs as per the current definition.5
The investment-based classification incentivises promoters to keep the investment size restricted to retain the benefits associated with the micro or small category.7
Turnover: The 2018 Bill sought to replace the investment criteria with annual turnover as the sole criteria for the classification of MSMEs. The Standing Committee agreed with the proposal under the Bill to use annual turnover as the criteria instead of investment.7 It observed that this could overcome some of the shortcomings of classification based on investment. While turnover based criteria will also require verification, the Committee noted that the GST Network (GSTN) data can act as a reliable source of information for this purpose. However, it also observed that:7
With turnover as a criterion for classification, corporates may misuse the incentives meant for MSMEs. For instance, there is a possibility that a multi-national company may produce a large quantity of products worth a high turnover and then market it through various subsidiaries registered as Micro or Small enterprise under GSTN.
The turnover of some enterprises may fluctuate depending on their business, which may result in the change of classification of the enterprise during a year.
The Committee noted that there is a wide gap in turnover limits. For instance, an enterprise with a turnover of Rs 6 crore and an enterprise with a turnover of Rs 75 crore (as proposed in 2018 Bill) would both be classified as a small enterprise, which seems incongruous.
The Expert Committee (RBI) also recommended using annual turnover as the criteria for classification instead of investment.5 It observed that turnover based definition would be transparent, progressive, and easier to implement through the GSTN. It also recommended that the power to change the definition of MSMEs should be delegated to the executive as it will help in responding to changing economic scenarios.
Number of employees: The Standing Committee had highlighted that in a labour-intensive country like India, appropriate focus is required on employment generation and MSME sector is the most suitable platform for this.7 It had recommended that the central government should assess the number of persons employed in the MSME sector and also consider employment as a criterion while classifying MSMEs. However, the Expert Committee (RBI) stated that while the employment-based definition is an additional feature preferred in some countries, the definition would pose challenges in implementation.5 According to the Ministry of MSME, employment as a criterion has problems due to: (i) factors such as seasonality and informal nature of engagement, (ii) similar to investment criteria, this would also require physical verification and has associated cost overheads.7
Number of MSMEs
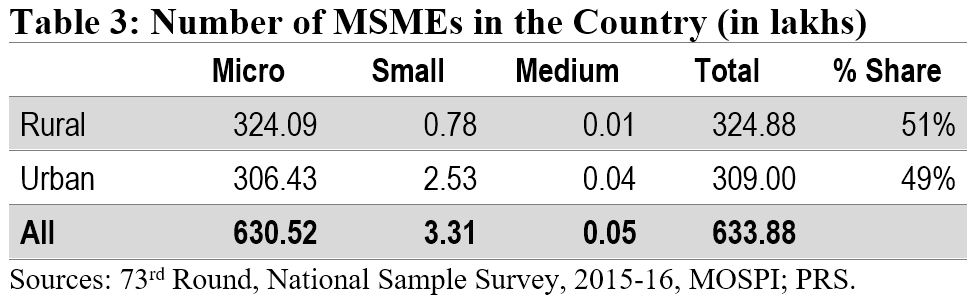
According to the National Sample Survey (2015-16), there were around 6.34 crore MSMEs in the country. The micro sector with 6.3 crore enterprises accounted for more than 99% of the total estimated number of MSMEs. The small and medium sectors accounted for only 0.52% and 0.01% of the estimated number of enterprises, respectively. Another dataset to understand the distribution of MSMEs is Udyog Aadhaar, a unique identity provided by the Unique Identification Authority of India (UIDAI) to MSME enterprises.[8] Udyog Aadhaar registration is based on self-declaration by enterprises. Between September 2015 and June 2020, 98.6 lakh enterprises have registered with UIDAI. According to this dataset, micro, small, and medium enterprises comprise 87.7%, 11.8% and 0.5% of the MSME sector respectively.
Employment in the MSME sector
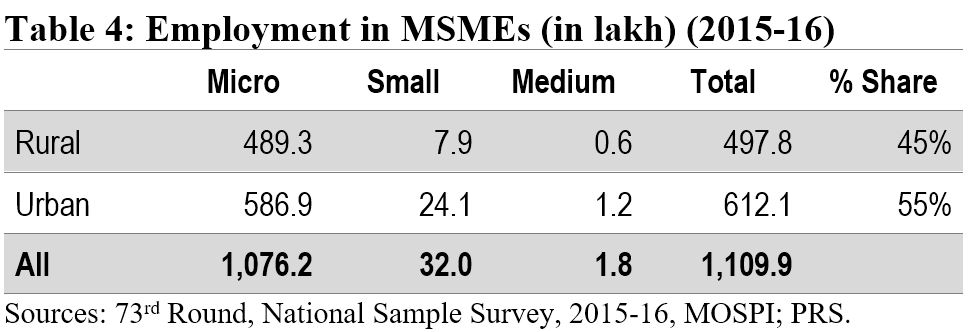
The MSME sector employed nearly 11.1 crore people in 2015-16. The sector was the second largest employer after the agriculture sector. The highest number of employed persons were engaged in trade activity (35%), followed by persons engaged in manufacturing (32%).
Implications of change in the definition of MSMEs
The change in the definition of MSMEs may result in many enterprises which are currently classified as Small enterprises be reclassified as Micro, and those classified as Medium enterprises be reclassified as Small. Further, there may be many enterprises which are not currently classified as MSMEs, which may fall under the MSME classification as per the new definition. Such enterprises will also now benefit from the schemes related to MSMEs. The Ministry of MSME runs various schemes to provide for: (i) flow of credit to MSMEs, (ii) support for technology upgrade and modernisation, (iii) entrepreneurship and skill development, and (iv) cluster-wise measures to promote capacity-building and empowerment of MSME units. For instance, under the Credit Guarantee Fund Scheme for Micro and Small Enterprises, a credit guarantee cover of up to 75% of the credit is provided to micro and small enterprises.[9] Thus, the re-classification may require a significant increase in budgetary allocation for the MSME sector.
Other announcements related to MSMEs in the aftermath of COVID-19
MSME sector accounted for nearly 33.4% of the total manufacturing output in 2017-18.[10] During the same year, its share in the country’s total exports was around 49%. Between 2015 and 2017, the contribution of the sector in GDP has been around 30%. Due to the national lockdown induced by COVID-19, businesses including MSMEs have been badly hit. To provide immediate relief to the MSME sector, the government announced several measures in May 2020.[11] These include: (i) collateral-free loans for MSMEs with up to Rs 25 crore outstanding and up to Rs 100 crore turnover, (ii) Rs 20,000 crore as subordinate debt for stressed MSMEs, and (iii) Rs 50,000 crore of capital infusion into MSMEs. These measures have also been approved by the Union Cabinet.[12]
For more details on the announcements made under the Aatma Nirbhar Bharat Abhiyan, see here.
[1] “Cabinet approves Upward revision of MSME definition and modalities/ road map for implementing remaining two Packages for MSMEs (a)Rs 20000 crore package for Distressed MSMEs and (b) Rs 50,000 crore equity infusion through Fund of Funds”, Press Information Bureau, Cabinet Committee on Economic Affairs, June 1, 2020.
[2] The Micro, Small and Medium Enterprises Development Act, 2006, https://samadhaan.msme.gov.in/WriteReadData/DocumentFile/MSMED2006act.pdf.
[3] The Micro, Small and Medium Enterprises Development (Amendment) Bill, 2015, https://www.prsindia.org/sites/default/files/bill_files/MSME_bill%2C_2015_0.pdf.
[4] The Micro, Small and Medium Enterprises Development (Amendment) Bill, 2018, https://www.prsindia.org/sites/default/files/bill_files/The%20Micro%2C%20Small%20and%20Medium%20Enterprises%20Development%20%28Amendment%29%20Bill%2C%202018%20Bill%20Text.pdf.
[5] Report of the Expert Committee on Micro, Small and Medium Enterprises, The Reserve Bank of India, July 2019, https://rbidocs.rbi.org.in/rdocs/PublicationReport/Pdfs/MSMES24062019465CF8CB30594AC29A7A010E8A2A034C.PDF.
[6] MSME Country Indicators 2014, International Finance Corporation, December 2014, https://www.smefinanceforum.org/sites/default/files/analysis%20note.pdf.
[7] 294th Report on Micro Small and Medium Enterprises Development (Amendment) Bill 2018, Standing Committee on Industry, Rajya Sabha, December 2018, https://rajyasabha.nic.in/rsnew/Committee_site/Committee_File/ReportFile/17/111/294_2019_3_15.pdf.
[8] Enterprises with Udyog Aadhaar Number, National Portal for Registration of Micro, Small & Medium Enterprises, Ministry of Micro, Small and Medium Enterprises, https://udyogaadhaar.gov.in/UA/Reports/StateBasedReport_R3.aspx.
[9] Credit Guarantee Fund Scheme for Micro and Small Enterprises, Ministry of Micro, Small and Medium Enterprises, http://www.dcmsme.gov.in/schemes/sccrguarn.htm.
[10] Annual Report 2018-19, Ministry of Micro, Small and Medium Enterprises, https://msme.gov.in/sites/default/files/Annualrprt.pdf.
[11] "Finance Minister announce measures for relief and credit support related to businesses, especially MSMEs to support Indian Economy’s fight against COVID-19", Press Information Bureau, Ministry of Finance, May 13, 2020.
[12] "Cabinet approves additional funding of up to Rupees three lakh crore through introduction of Emergency Credit Line Guarantee Scheme (ECLGS)", Press Information Bureau, Ministry of Finance, May 20, 2020.

