By Rohit & Anirudh A modified 'Modernization of State Police Forces' scheme was started by the central government in 2000-01. One of the objectives was to help police forces in meeting the emerging challenges to internal security in the form of terrorism, naxalism etc. The scheme aims to modernize police forces in terms of:
Under this scheme, States have been clubbed into different categories and Centre-State cost sharing is category specific. Since 2005-06, States have been categorized as category ‘A’ and ‘B’ with 100% and 75% Central funding respectively. All the North Eastern States, namely Arunachal Pradesh, Assam, Manipur, Meghalaya, Mizoram, Nagaland, Tripura and Sikkim have been placed in category ‘A’ and thus, are entitled to receive 100% Central assistance for implementation of their annual approved plans. Recently, CAG decided to evaluate the working of the scheme and commissioned ‘performance audit’ reviews covering select general category and special category States. Each review covers a contiguous five year period between 2000 and 2007, but varies across selected states. For the periods under review, each state had a plan outlay (the total amount proposed to be spent in modernizing the state's police forces). However, in most cases, the actual release of funds fell significantly short of this outlay - in some cases the Centre did not contribute its share, in others the States lagged behind. For instance, in the case of Bihar, the Centre released only 56% of its share; while in the case of Rajasthan and West Bengal, the States did not release any funds at all. The graph below shows the actual releases by the Centre and the States (as percentages of their share in the proposed outlays):  Further, even the funds that were released were not fully utilized. Thus, the amount finally spent fell significantly short of the initial proposal. The graph below shows the actual expenditure by State:
  Following are some of the other main findings from the CAG report:
|
Table 1: Summary of main findings in the CAG audit for different states for Modernisation of State Police Forces |
|
|
Purpose for which money was sanctioned |
Summary of CAG Findings |
|
Planning (Every state has to propose an Annual Action Plan every year. The plan is approved by the Ministry of Home Affairs and money is released as per the plan.) |
§ Submissions by the states to the MHA were delayed. § There were also delays in the clearance granted by the MHA. § In various states such as, a) Andhra Pradesh – the government spent money on works not covered by the Annual Action Plan. b) Bihar – Persistent delays in preparation of the Plan by the state police. c) West Bengal – the plans drawn up by the state did not include items covered under the scheme. |
|
Mobility |
§ Overall shortage of vehicles was observed. Most of the new vehicles replaced the old ones. § The police response time was too long in some states. § To give examples from some states: a) Andhra Pradesh – 58 percent of vehicles procured were utilised for replacing old vehicles. b) Bihar – the shortage of vehicles was 43 percent. c) Uttar Pradesh – 2400 vehicles were procured against a shortage of nearly 10,000 vehicles. |
|
Residential and non-residential buildings |
§ There were considerable delays in construction of buildings in most states. Consequently, police forces’ own security was in jeopardy. § In states such as: a) Andhra Pradesh – 53 percent of staff quarters and 43 percent of official buildings were not completed (2007). b) Bihar – The total requirement of housing was nearly 60,000. Only six percent of this were included in the Plan. c) Jharkhand – District Control rooms remained non-functional because of shortage of manpower. |
|
Weapons |
§ Police force in states continue to depend on outdated weapons. § Shortages of weapons also happened as acquisition from ordnance factories was very slow. § The weapons that were procured were mostly kept in the district headquarters. § In some states such as, a) Bihar – AK-47s were kept at the disposal of bodyguards of VIPs. b) West Bengal – Adequate weapons were not supplied to extremist prone police stations. |
|
Communication |
§ Police Telecommunication Networks were not set up successfully in some states. In others, network was functional only up to the district level. § Shortages of various communication equipments were also observed. § In some states such as, a) Bihar - The Police Telecommunication Network system (costing Rs. 4.96 crore) remained non-functional due to non-construction of tower. b) Maharashtra – Of the 850 purchased Remote Station Units, 452 were lying in stores. |
|
Forensic Science Laboratory/ Finger Printing Bureau |
§ In most States the Forensic Science Laboratories lacked adequate infrastructure. § In the absence of automatic finger print identification systems, investigation was being done manually in some States. § In some states such as, a) Maharashtra - There were significant delays in receipt and installation. There was also shortage (284 vacant posts) of technical manpower. b) West Bengal - Performance of the Forensic Science Laboratory was poor and in some cases, the delay in issue of investigation reports was as high as 45 months. |
|
Training |
§ It was observed that the percentage of police personnel trained was very low. § Training infrastructure was also inadequate. § In some states such as, a) Bihar - Only 10 per cent of total force was trained. b) West Bengal - Live training was not imparted for handling useful weapons and this severely affected the performance of police forces. |
|
Sources: CAG Compendium of Performance Audit Reviews on Modernisation of Police Force; PRS. Note: The audit has been done broadly from 2000 to 2007. Consequently, the period of audit for different states may vary. |
|
|
Table 1: Summary of main findings in the CAG audit for different states for Modernisation of State Police Forces |
|
|
Purpose for which money was sanctioned |
Summary of CAG Findings |
|
Planning (Every state has to propose an Annual Action Plan every year. The plan is approved by the Ministry of Home Affairs and money is released as per the plan.) |
§ Submissions by the states to the Ministry of Home Affairs (MHA) were delayed. § There were also delays in the clearance granted by the MHA. § In various states such as, a) Andhra Pradesh – the government spent Rs 32 crore on works not covered by the Annual Action Plan. b) Bihar – Persistent delays in preparation of the Plan by the state police. c) West Bengal – the plans drawn up by the state did not include items covered under the scheme. |
|
Mobility |
§ Overall shortage of vehicles was observed. Most of the new vehicles replaced the old ones, and no additions were made. § The police response time was too long in some states. § To give examples from some states: a) Andhra Pradesh – 58 percent of vehicles procured were utilised for replacing old vehicles. b) Bihar – the shortage of vehicles was 43 percent. c) Uttar Pradesh – 2400 vehicles were procured against a shortage of nearly 10,000 vehicles. 203 ambassador cars were procured, though only 55 were approved by the MHA. |
|
Residential and non-residential buildings |
§ There were considerable delays in construction of buildings in most states. Consequently, police forces’ own security was in jeopardy. Satisfaction levels with the housing provided were also very low. § In states such as: a) Andhra Pradesh – 53 percent of staff quarters and 43 percent of official buildings were not completed (2007). b) Bihar – The total requirement of housing was nearly 60,000. Only six percent of this were included in the Plan, and only 1045 units were completed by 2006. c) Jharkhand – District Control rooms remained non-functional even after spending Rs 2 crore because of shortage of manpower. |
|
Weapons |
§ It was observed that the police force in states continue to depend on outdated weapons. § Shortages of weapons also happened as acquisition from ordnance factories was very slow. § The weapons that were procured were mostly kept in the district headquarters. § In some states such as, a) Bihar – AK-47s were kept at the disposal of bodyguards of VIPs. b) West Bengal – Adequate weapons were not supplied to extremist prone police stations. |
|
Communication |
§ Police Telecommunication Networks were not set up successfully in some states. In others, network was functional only up to the district level. § Shortages of various communication equipments were also observed. § In some states such as, a) Bihar - The Police Telecommunication Network system (costing Rs. 4.96 crore) remained non-functional due to non-construction of tower. b) Maharashtra – Of the 850 purchased Remote Station Units, 452 were lying in stores. |
|
Forensic Science Laboratory/ Finger Printing Bureau |
§ In most States the Forensic Science Laboratories lacked adequate infrastructure. § In the absence of automatic finger print identification systems, investigation was being done manually in some States. § In some states such as, a) Maharashtra - There were significant delays in receipt and installation. There was also shortage (284 vacant posts) of technical manpower. b) West Bengal - Performance of the Forensic Science Laboratory was poor and in some cases, the delay in issue of investigation reports was as high as 45 months. |
|
Training |
§ It was observed that the percentage of police personnel trained was very low. § Training infrastructure was also inadequate. § In some states such as, a) Bihar - Only 10 per cent of total force was trained. b) West Bengal - Live training was not imparted for handling useful weapons and this severely affected the performance of police forces. |
|
Sources: CAG Compendium of Performance Audit Reviews on Modernisation of Police Force; PRS. Note: The audit has been done broadly from 2000 to 2007. Consequently, the period of audit for different states may vary. |
|
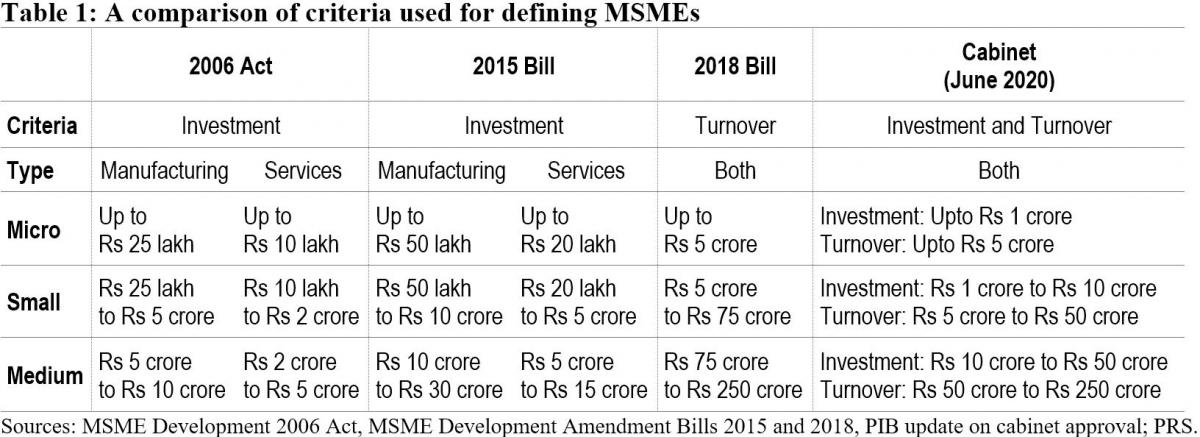
On June 1, 2020, the Cabinet Committee on Economic Affairs approved a revision in the definition of Micro, Small and Medium Enterprises (MSMEs).[1] In this blog, we discuss the change in the definition as approved by the Cabinet, and examine some of the common criteria used for classification of MSMEs.
Currently, MSMEs are defined under the Micro, Small and Medium Enterprises Development Act, 2006.[2] The Act classifies them as micro, small and medium enterprises based on: (i) investment in plant and machinery for enterprises engaged in manufacturing or production of goods, and (ii) investment in equipment for enterprises providing services. As per the Cabinet approval, the investment limits will be revised upwards and annual turnover of the enterprise will be used as additional criteria for the classification of MSMEs (Table 1).
Earlier attempts to amend the definition of MSMEs
The central government has sought to revise the definition of MSMEs in the Act on two earlier occasions. The government introduced the MSME Development (Amendment) Bill, 2015 which proposed to increase the investment limits for manufacturing and services MSMEs.[3] This Bill was withdrawn in July 2018 and another Bill was introduced. The MSME Development (Amendment) Bill, 2018 proposed to: (i) use annual turnover as criteria instead of investment for classification of MSMEs, (ii) remove the distinction between manufacturing and services, and (iii) provide the central government with the power to revise the turnover limits, through a notification.[4] The 2018 Bill lapsed with the dissolution of 16th Lok Sabha.
Global trends in criteria for the classification of MSMEs
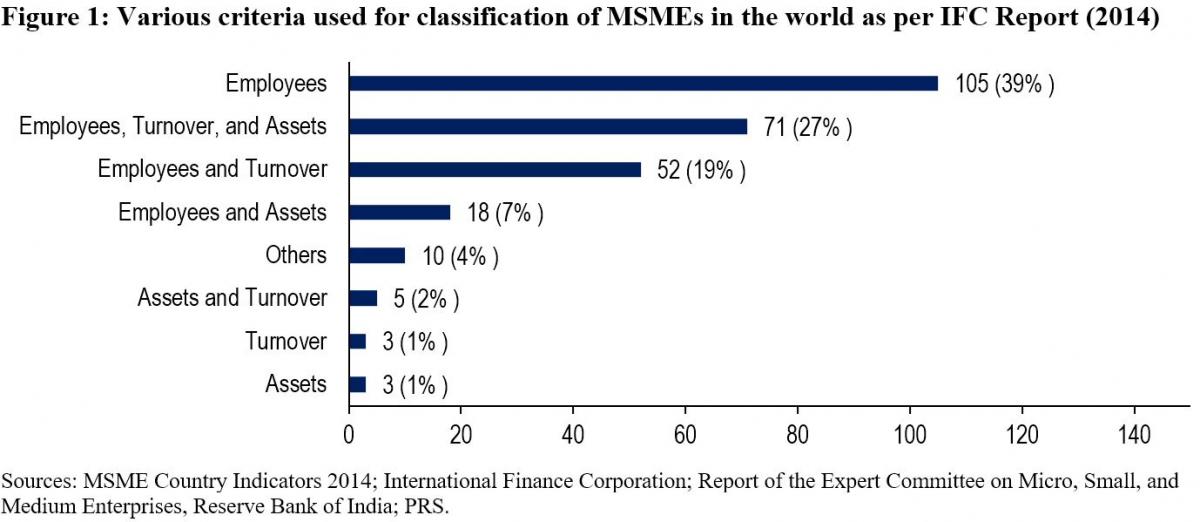
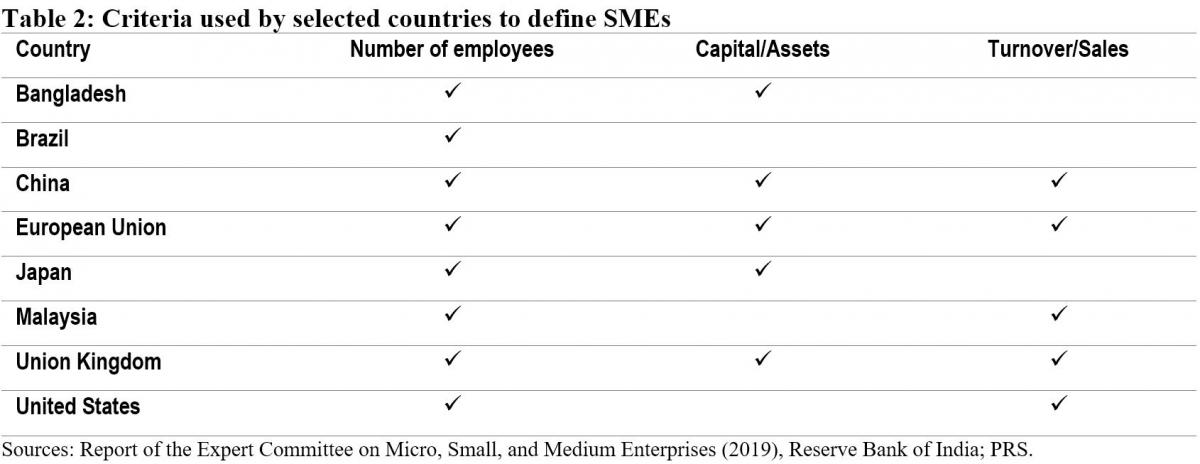
While India will now be using investment and annual turnover as the criteria to classify MSMEs, globally, the number of employees is the most widely used criteria for classifying MSMEs. The Reserve Bank of India's Expert Committee on MSMEs (2019) cited a study by the International Finance Corporation in 2014 which analysed 267 definitions used by different institutions in 155 countries.[5],[6] According to the study, countries used a combination of criteria to classify MSMEs. 92% of the definitions used the number of employees as one of the criteria. Other frequently used criteria were: (i) turnover (49%), and (ii) value of assets (36%). 11% of the analysed definitions used alternative criteria such as: (i) loan size, (ii) years of experience, and (iii) initial investment.
Evaluation of common criteria used to define MSMEs
Investment: The 2006 Act uses investment in plant, machinery, and equipment to classify MSMEs. Some of the issues with the investment criteria include:
Due to their informal and small scale of operations, firms often do not maintain proper books of accounts and hence find it difficult to get classified as MSMEs as per the current definition.5
The investment-based classification incentivises promoters to keep the investment size restricted to retain the benefits associated with the micro or small category.7
Turnover: The 2018 Bill sought to replace the investment criteria with annual turnover as the sole criteria for the classification of MSMEs. The Standing Committee agreed with the proposal under the Bill to use annual turnover as the criteria instead of investment.7 It observed that this could overcome some of the shortcomings of classification based on investment. While turnover based criteria will also require verification, the Committee noted that the GST Network (GSTN) data can act as a reliable source of information for this purpose. However, it also observed that:7
With turnover as a criterion for classification, corporates may misuse the incentives meant for MSMEs. For instance, there is a possibility that a multi-national company may produce a large quantity of products worth a high turnover and then market it through various subsidiaries registered as Micro or Small enterprise under GSTN.
The turnover of some enterprises may fluctuate depending on their business, which may result in the change of classification of the enterprise during a year.
The Committee noted that there is a wide gap in turnover limits. For instance, an enterprise with a turnover of Rs 6 crore and an enterprise with a turnover of Rs 75 crore (as proposed in 2018 Bill) would both be classified as a small enterprise, which seems incongruous.
The Expert Committee (RBI) also recommended using annual turnover as the criteria for classification instead of investment.5 It observed that turnover based definition would be transparent, progressive, and easier to implement through the GSTN. It also recommended that the power to change the definition of MSMEs should be delegated to the executive as it will help in responding to changing economic scenarios.
Number of employees: The Standing Committee had highlighted that in a labour-intensive country like India, appropriate focus is required on employment generation and MSME sector is the most suitable platform for this.7 It had recommended that the central government should assess the number of persons employed in the MSME sector and also consider employment as a criterion while classifying MSMEs. However, the Expert Committee (RBI) stated that while the employment-based definition is an additional feature preferred in some countries, the definition would pose challenges in implementation.5 According to the Ministry of MSME, employment as a criterion has problems due to: (i) factors such as seasonality and informal nature of engagement, (ii) similar to investment criteria, this would also require physical verification and has associated cost overheads.7
Number of MSMEs
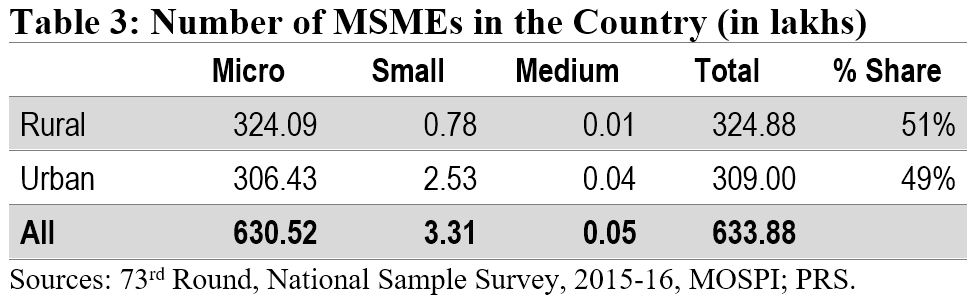
According to the National Sample Survey (2015-16), there were around 6.34 crore MSMEs in the country. The micro sector with 6.3 crore enterprises accounted for more than 99% of the total estimated number of MSMEs. The small and medium sectors accounted for only 0.52% and 0.01% of the estimated number of enterprises, respectively. Another dataset to understand the distribution of MSMEs is Udyog Aadhaar, a unique identity provided by the Unique Identification Authority of India (UIDAI) to MSME enterprises.[8] Udyog Aadhaar registration is based on self-declaration by enterprises. Between September 2015 and June 2020, 98.6 lakh enterprises have registered with UIDAI. According to this dataset, micro, small, and medium enterprises comprise 87.7%, 11.8% and 0.5% of the MSME sector respectively.
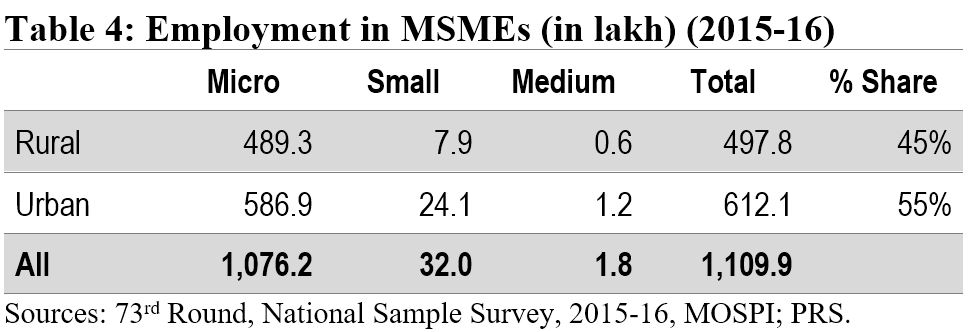
Employment in the MSME sector
The MSME sector employed nearly 11.1 crore people in 2015-16. The sector was the second largest employer after the agriculture sector. The highest number of employed persons were engaged in trade activity (35%), followed by persons engaged in manufacturing (32%).
Implications of change in the definition of MSMEs
The change in the definition of MSMEs may result in many enterprises which are currently classified as Small enterprises be reclassified as Micro, and those classified as Medium enterprises be reclassified as Small. Further, there may be many enterprises which are not currently classified as MSMEs, which may fall under the MSME classification as per the new definition. Such enterprises will also now benefit from the schemes related to MSMEs. The Ministry of MSME runs various schemes to provide for: (i) flow of credit to MSMEs, (ii) support for technology upgrade and modernisation, (iii) entrepreneurship and skill development, and (iv) cluster-wise measures to promote capacity-building and empowerment of MSME units. For instance, under the Credit Guarantee Fund Scheme for Micro and Small Enterprises, a credit guarantee cover of up to 75% of the credit is provided to micro and small enterprises.[9] Thus, the re-classification may require a significant increase in budgetary allocation for the MSME sector.
Other announcements related to MSMEs in the aftermath of COVID-19
MSME sector accounted for nearly 33.4% of the total manufacturing output in 2017-18.[10] During the same year, its share in the country’s total exports was around 49%. Between 2015 and 2017, the contribution of the sector in GDP has been around 30%. Due to the national lockdown induced by COVID-19, businesses including MSMEs have been badly hit. To provide immediate relief to the MSME sector, the government announced several measures in May 2020.[11] These include: (i) collateral-free loans for MSMEs with up to Rs 25 crore outstanding and up to Rs 100 crore turnover, (ii) Rs 20,000 crore as subordinate debt for stressed MSMEs, and (iii) Rs 50,000 crore of capital infusion into MSMEs. These measures have also been approved by the Union Cabinet.[12]
For more details on the announcements made under the Aatma Nirbhar Bharat Abhiyan, see here.
[1] “Cabinet approves Upward revision of MSME definition and modalities/ road map for implementing remaining two Packages for MSMEs (a)Rs 20000 crore package for Distressed MSMEs and (b) Rs 50,000 crore equity infusion through Fund of Funds”, Press Information Bureau, Cabinet Committee on Economic Affairs, June 1, 2020.
[2] The Micro, Small and Medium Enterprises Development Act, 2006, https://samadhaan.msme.gov.in/WriteReadData/DocumentFile/MSMED2006act.pdf.
[3] The Micro, Small and Medium Enterprises Development (Amendment) Bill, 2015, https://www.prsindia.org/sites/default/files/bill_files/MSME_bill%2C_2015_0.pdf.
[4] The Micro, Small and Medium Enterprises Development (Amendment) Bill, 2018, https://www.prsindia.org/sites/default/files/bill_files/The%20Micro%2C%20Small%20and%20Medium%20Enterprises%20Development%20%28Amendment%29%20Bill%2C%202018%20Bill%20Text.pdf.
[5] Report of the Expert Committee on Micro, Small and Medium Enterprises, The Reserve Bank of India, July 2019, https://rbidocs.rbi.org.in/rdocs/PublicationReport/Pdfs/MSMES24062019465CF8CB30594AC29A7A010E8A2A034C.PDF.
[6] MSME Country Indicators 2014, International Finance Corporation, December 2014, https://www.smefinanceforum.org/sites/default/files/analysis%20note.pdf.
[7] 294th Report on Micro Small and Medium Enterprises Development (Amendment) Bill 2018, Standing Committee on Industry, Rajya Sabha, December 2018, https://rajyasabha.nic.in/rsnew/Committee_site/Committee_File/ReportFile/17/111/294_2019_3_15.pdf.
[8] Enterprises with Udyog Aadhaar Number, National Portal for Registration of Micro, Small & Medium Enterprises, Ministry of Micro, Small and Medium Enterprises, https://udyogaadhaar.gov.in/UA/Reports/StateBasedReport_R3.aspx.
[9] Credit Guarantee Fund Scheme for Micro and Small Enterprises, Ministry of Micro, Small and Medium Enterprises, http://www.dcmsme.gov.in/schemes/sccrguarn.htm.
[10] Annual Report 2018-19, Ministry of Micro, Small and Medium Enterprises, https://msme.gov.in/sites/default/files/Annualrprt.pdf.
[11] "Finance Minister announce measures for relief and credit support related to businesses, especially MSMEs to support Indian Economy’s fight against COVID-19", Press Information Bureau, Ministry of Finance, May 13, 2020.
[12] "Cabinet approves additional funding of up to Rupees three lakh crore through introduction of Emergency Credit Line Guarantee Scheme (ECLGS)", Press Information Bureau, Ministry of Finance, May 20, 2020.

