The percentage of the population living below the poverty line in India decreased to 22% in 2011-12 from 37% in 2004-05, according to data released by the Planning Commission in July 2013. This blog presents data on recent poverty estimates and goes on to provide a brief history of poverty estimation in the country. National and state-wise poverty estimates The Planning Commission estimates levels of poverty in the country on the basis of consumer expenditure surveys conducted by the National Sample Survey Office (NSSO) of the Ministry of Statistics and Programme Implementation.
The current methodology for poverty estimation is based on the recommendations of an Expert Group to Review the Methodology for Estimation of Poverty (Tendulkar Committee) established in 2005. The Committee calculated poverty levels for the year 2004- 05. Poverty levels for subsequent years were calculated on the basis of the same methodology, after adjusting for the difference in prices due to inflation. Table 1 shows national poverty levels for the last twenty years, using methodology suggested by the Tendulkar Committee. According to these estimates, poverty declined at an average rate of 0.74 percentage points per year between 1993-94 and 2004-05, and at 2.18 percentage points per year between 2004-05 and 2011-12. Table 1: National poverty estimates (% below poverty line) (1993 - 2012)
| Year |
Rural |
Urban |
Total |
| 1993 – 94 |
50.1 |
31.8 |
45.3 |
| 2004 – 05 |
41.8 |
25.7 |
37.2 |
| 2009 – 10 |
33.8 |
20.9 |
29.8 |
| 2011 – 12 |
25.7 |
13.7 |
21.9 |
Source: Press Note on Poverty Estimates, 2011 – 12, Planning Commission; Report of the Expert Group to Review the Methodology for Estimation of Poverty (2009) Planning Commission; PRS. State-wise data is also released by the NSSO. Table 2 shows state-wise poverty estimates for 2004-05 and 2011-12. It shows that while there is a decrease in poverty for almost all states, there are wide inter-state disparities in the percentage of poor below the poverty line and the rate at which poverty levels are declining. Table 2: State-wise poverty estimates (% below poverty line) (2004-05, 2011-12)
| State |
2004-05 |
2011-12 |
Decrease |
| Andhra Pradesh |
29.9 |
9.2 |
20.7 |
| Arunachal Pradesh |
31.1 |
34.7 |
-3.6 |
| Assam |
34.4 |
32 |
2.4 |
| Bihar |
54.4 |
33.7 |
20.7 |
| Chhattisgarh |
49.4 |
39.9 |
9.5 |
| Delhi |
13.1 |
9.9 |
3.2 |
| Goa |
25 |
5.1 |
19.9 |
| Gujarat |
31.8 |
16.6 |
15.2 |
| Haryana |
24.1 |
11.2 |
12.9 |
| Himachal Pradesh |
22.9 |
8.1 |
14.8 |
| Jammu and Kashmir |
13.2 |
10.4 |
2.8 |
| Jharkhand |
45.3 |
37 |
8.3 |
| Karnataka |
33.4 |
20.9 |
12.5 |
| Kerala |
19.7 |
7.1 |
12.6 |
| Madhya Pradesh |
48.6 |
31.7 |
16.9 |
| Maharashtra |
38.1 |
17.4 |
20.7 |
| Manipur |
38 |
36.9 |
1.1 |
| Meghalaya |
16.1 |
11.9 |
4.2 |
| Mizoram |
15.3 |
20.4 |
-5.1 |
| Nagaland |
9 |
18.9 |
-9.9 |
| Odisha |
57.2 |
32.6 |
24.6 |
| Puducherry |
14.1 |
9.7 |
4.4 |
| Punjab |
20.9 |
8.3 |
12.6 |
| Rajasthan |
34.4 |
14.7 |
19.7 |
| Sikkim |
31.1 |
8.2 |
22.9 |
| Tamil Nadu |
28.9 |
11.3 |
17.6 |
| Tripura |
40.6 |
14.1 |
26.5 |
| Uttar Pradesh |
40.9 |
29.4 |
11.5 |
| Uttarakhand |
32.7 |
11.3 |
21.4 |
| West Bengal |
34.3 |
20 |
14.3 |
| All Inda |
37.2 |
21.9 |
15.3 |
Source: Review of Expert Group to Review the Methodology for Estimation of Poverty (2009) Planning Commission, Government of India; Press Note on Poverty Estimates, 2011 – 12 (2013) Planning Commission, Government of India; PRS. Note: A negative sign before the number in column four (decrease) indicates an increase in percentage of population below the poverty line. History of poverty estimation in India Pre independence poverty estimates: One of the earliest estimations of poverty was done by Dadabhai Naoroji in his book, ‘Poverty and the Un-British Rule in India’. He formulated a poverty line ranging from Rs 16 to Rs 35 per capita per year, based on 1867-68 prices. The poverty line proposed by him was based on the cost of a subsistence diet consisting of ‘rice or flour, dhal, mutton, vegetables, ghee, vegetable oil and salt’. Next, in 1938, the National Planning Committee (NPC) estimated a poverty line ranging from Rs 15 to Rs 20 per capita per month. Like the earlier method, the NPC also formulated its poverty line based on ‘a minimum standard of living perspective in which nutritional requirements are implicit’. In 1944, the authors of the ‘Bombay Plan’ (Thakurdas et al 1944) suggested a poverty line of Rs 75 per capita per year. Post independence poverty estimates: In 1962, the Planning Commission constituted a working group to estimate poverty nationally, and it formulated separate poverty lines for rural and urban areas – of Rs 20 and Rs 25 per capita per year respectively. VM Dandekar and N Rath made the first systematic assessment of poverty in India in 1971, based on National Sample Survey (NSS) data from 1960-61. They argued that the poverty line must be derived from the expenditure that was adequate to provide 2250 calories per day in both rural and urban areas. This generated debate on minimum calorie consumption norms while estimating poverty and variations in these norms based on age and sex. Alagh Committee (1979): In 1979, a task force constituted by the Planning Commission for the purpose of poverty estimation, chaired by YK Alagh, constructed a poverty line for rural and urban areas on the basis of nutritional requirements. Table 3 shows the nutritional requirements and related consumption expenditure based on 1973-74 price levels recommended by the task force. Poverty estimates for subsequent years were to be calculated by adjusting the price level for inflation. Table 3: Minimum calorie consumption and per capita consumption expenditure as per the 1979 Planning Commission task force on poverty estimation
| Area | Calories | Minimum consumption expenditure (Rs per capita per month) |
| Rural | 2400 | 49.1 |
| Urban | 2100 | 56.7 |
Source: Report of the Expert Group on Estimation of Proportion and Number of Poor, 1993, Perspective Planning Division, Planning Commission; PRS Lakdawala Committee (1993): In 1993, an expert group constituted to review methodology for poverty estimation, chaired by DT Lakdawala, made the following suggestions: (i) consumption expenditure should be calculated based on calorie consumption as earlier; (ii) state specific poverty lines should be constructed and these should be updated using the Consumer Price Index of Industrial Workers (CPI-IW) in urban areas and Consumer Price Index of Agricultural Labour (CPI-AL) in rural areas; and (iii) discontinuation of ‘scaling’ of poverty estimates based on National Accounts Statistics. This assumes that the basket of goods and services used to calculate CPI-IW and CPI-AL reflect the consumption patterns of the poor. Tendulkar Committee (2009): In 2005, another expert group to review methodology for poverty estimation, chaired by Suresh Tendulkar, was constituted by the Planning Commission to address the following three shortcomings of the previous methods: (i) consumption patterns were linked to the 1973-74 poverty line baskets (PLBs) of goods and services, whereas there were significant changes in the consumption patterns of the poor since that time, which were not reflected in the poverty estimates; (ii) there were issues with the adjustment of prices for inflation, both spatially (across regions) and temporally (across time); and (iii) earlier poverty lines assumed that health and education would be provided by the State and formulated poverty lines accordingly.[1] It recommended four major changes: (i) a shift away from calorie consumption based poverty estimation; (ii) a uniform poverty line basket (PLB) across rural and urban India; (iii) a change in the price adjustment procedure to correct spatial and temporal issues with price adjustment; and (iv) incorporation of private expenditure on health and education while estimating poverty. The Committee recommended using Mixed Reference Period (MRP) based estimates, as opposed to Uniform Reference Period (URP) based estimates that were used in earlier methods for estimating poverty.[2] It based its calculations on the consumption of the following items: cereal, pulses, milk, edible oil, non-vegetarian items, vegetables, fresh fruits, dry fruits, sugar, salt & spices, other food, intoxicants, fuel, clothing, footwear, education, medical (non-institutional and institutional), entertainment, personal & toilet goods, other goods, other services and durables. The Committee computed new poverty lines for rural and urban areas of each state. To do this, it used data on value and quantity consumed of the items mentioned above by the population that was classified as poor by the previous urban poverty line. It concluded that the all India poverty line was Rs 446.68 per capita per month in rural areas and Rs 578.80 per capita per month in urban areas in 2004-05. The following table outlines the manner in which the percentage of population below the poverty line changed after the application of the Tendulkar Committee’s methodology. Table 4: Percentage of population below poverty line calculated by the Lakdawala Committee and the Tendulkar Committee for the year 2004-05
| Committee |
Rural |
Urban |
Total |
| Lakdawala Committee |
28.3 |
25.7 |
27.5 |
| Tendulkar Committee |
41.8 |
27.5 |
37.2 |
Source: Report of the Expert Group on Estimation of Proportion and Number of Poor, 1993, Perspective Planning Division, Planning Commission; Report of the Expert Group to Review the Methodology for Estimation of Poverty, 2009, Planning Commission; PRS The Committee also recommended a new method of updating poverty lines, adjusting for changes in prices and patterns of consumption, using the consumption basket of people close to the poverty line. Thus, the estimates released in 2009-10 and 2011-12 use this method instead of using indices derived from the CPI-AL for rural areas and CPI-IW for urban areas as was done earlier. Table 5 outlines the poverty lines computed using the Tendulkar Committee methodology for the years 2004-05, 2009-10 and 2011-12. Table 5: National poverty lines (in Rs per capita per month) for the years 2004-05, 2009-10 and 2011-12
| Year |
Rural |
Urban |
| 2004-05 |
446.7 |
578.8 |
| 2009-10 |
672.8 |
859.6 |
| 2011-12 |
816.0 |
1000.0 |
Source: Report of the Expert Group to Review the Methodology for Estimation of Poverty (2009) Planning Commission; Poverty Estimates 2009-10 and Poverty Estimates 2011-12, Planning Commission; PRS Rangarajan Committee: In 2012, the Planning Commission constituted a new expert panel on poverty estimation, chaired by C Rangarajan with the following key objectives: (i) to provide an alternate method to estimate poverty levels and examine whether poverty lines should be fixed solely in terms of a consumption basket or if other criteria are also relevant; (ii) to examine divergence between the consumption estimates based on the NSSO methodology and those emerging from the National Accounts aggregates; (iii) to review international poverty estimation methods and indicate whether based on these, a particular method for empirical poverty estimation can be developed in India, and (iv) to recommend how these estimates of poverty can be linked to eligibility and entitlements under the various schemes of the Government of India. The Committee is expected to submit its report by 2014.
[1] While private expenditure on education and health was covered in the base year 1973-74, no account was taken of either the increase in the proportion of these in total expenditure over time or of their proper representation in available price indices.
[2] Under the URP method, respondents are asked to detail consumption over the previous 30 days; whereas under the MRP method five low-frequency items (clothing, footwear, durables, education and institutional health expenditure) are surveyed over the previous 365 days, and all other items over the previous 30 days.
India has been in lockdown since March 25, 2020. During this time, activities not contributing to the production and supply of essential goods and services were completely or partially suspended. Passenger trains and flights were halted. The lockdown has severely impacted migrants, several of whom lost their jobs due to shutting of industries and were stranded outside their native places wanting to get back. Since then, the government has announced relief measures for migrants, and made arrangements for migrants to return to their native place. The Supreme Court of India, recognising the problems faced by migrants stranded in different parts of the country, reviewed transportation and relief arrangements made by the government. On June 9, the Court directed central and state governments to complete transportation of remaining stranded migrants and expand focus of relief measures to facilitate employment for returning migrants. In this blog, we highlight some facts about migration in India, summarise key relief measures announced by the government and directives issued by the Supreme Court for the migrant population in relation to the lockdown.
Overview of Migration
Migration is the movement of people away from their usual place of residence, across either internal (within country) or international (across countries) borders. The latest government data on migration comes from the 2011 Census. As per the Census, India had 45.6 crore migrants in 2011 (38% of the population) compared to 31.5 crore migrants in 2001 (31% of the population). Between 2001 and 2011, while population grew by 18%, the number of migrants increased by 45%. In 2011, 99% of total migration was internal and immigrants (international migrants) comprised 1%.[1]
Patterns of migration
Internal migrant flows can be classified on the basis of origin and destination. One kind of classification is: i) rural-rural, ii) rural-urban, iii) urban-rural and iv) urban-urban. As per the 2011 census, there were 21 crore rural-rural migrants which formed 54% of classifiable internal migration (the Census did not classify 5.3 crore people as originating from either rural or urban areas). Rural-urban and urban-urban movement accounted for around 8 crore migrants each. There were around 3 crore urban-rural migrants (7% of classifiable internal migration).
Another way to classify migration is: (i) intra-state, and (ii) inter-state. In 2011, intra-state movement accounted for almost 88% of all internal migration (39.6 crore persons).1
There is variation across states in terms of inter-state migration flows. According to the 2011 Census, there were 5.4 crore inter-state migrants. As of 2011, Uttar Pradesh and Bihar were the largest source of inter-state migrants while Maharashtra and Delhi were the largest receiver states. Around 83 lakh residents of Uttar Pradesh and 63 lakh residents of Bihar had moved either temporarily or permanently to other states. Around 60 lakh people from across India had migrated to Maharashtra by 2011.
Figure 1: Inter-state Migration (in lakh)

Note: A net out-migrant state is one where more people migrate out of the state than those that migrate into the state. Net in-migration is the excess of incoming migrants over out-going migrants.
Sources: Census 2011; PRS.
Reasons for internal migration and size of migrant labour force
As of 2011, majority (70%) of intra-state migration was due to reasons of marriage and family with variation between male and female migrants. While 83% of females moved for marriage and family, the corresponding figure for males was 39%. Overall, 8% of people moved within a state for work (21% of male migrants and 2% of female migrants).
Movement for work was higher among inter-state migrants- 50% of male and 5% of female inter-state migrants. As per the Census, there were 4.5 crore migrant workers in 2011. However, according to the Working Group Report on Migration, the Census underestimates the migrant worker population. Female migration is recorded as movement due to family since that is the primary reason. However, many women take up employment after migrating which is not reflected in the number of women moving for work-related reasons. [2]
According to the Economic Survey, 2016-17, Census data also underestimates temporary migrant labour movement. In 2007-08, the NSSO estimated the size of India’s migrant labour at seven crore (29% of the workforce). The Economic Survey, 2016-17, estimated six crore inter-state labour migrants between 2001-2011. The Economic Survey also estimated that in each year between 2011-2016, on average 90 lakh people travelled for work.
Figure 2: Reasons for intra-state migration

Sources: Census 2011; PRS.
Figure 3:Reasons for inter-state migration

Sources: Census 2011; PRS.
Issues faced by migrant labour
Article 19(1)(e) of the Constitution, guarantees all Indian citizens the right to reside and settle in any part of the territory of India, subject to reasonable restrictions in the interest of the general public or protection of any scheduled tribe. However, people migrating for work face key challenges including: i) lack of social security and health benefits and poor implementation of minimum safety standards law, ii) lack of portability of state-provided benefits especially food provided through the public distribution system (PDS) and iii) lack of access to affordable housing and basic amenities in urban areas. 2
Poor implementation of protections under the Inter-State Migrant Workmen Act, 1979 (ISMW Act)
The ISMW Act provides certain protections for inter-state migrant workers. Labour contractors recruiting migrants are required to: (i) be licensed, (ii) register migrant workers with the government authorities, and (iii) arrange for the worker to be issued a passbook recording their identity. Guidelines regarding wages and protections (including accommodation, free medical facilities, protective clothing) to be provided by the contractor are also outlined in the law.
In December 2011, a report by the Standing Committee on Labour observed that registration of workers under the ISMW Act was low and implementation of protections outlined in the Act was poor. The report concluded that the Central government had not made any concrete and fruitful efforts to ensure that contractors and employers mandatorily register the workers employed with them enabling access to benefits under the Act.
Lack of portability of benefits
Migrants registered to claim access to benefits at one location lose access upon migration to a different location. This is especially true of access to entitlements under the PDS. Ration card required to access benefits under the PDS is issued by state governments and is not portable across states. This system excludes inter-state migrants from the PDS unless they surrender their card from the home state and get a new one from the host state.
Lack of affordable housing and basic amenities in urban areas
The proportion of migrants in urban population is 47%.1 In 2015, the Ministry of Housing and Urban Affairs identified migrants in urban areas as the largest population needing housing in cities. There is inadequate supply of low-income ownership and rental housing options. This leads to the spread of informal settlements and slums. The Prime Minister Awaas Yojana (PMAY) is a central government scheme to help the economically weaker section and low-income group access housing. Assistance under the scheme includes: i) slum rehabilitation, ii) subsidised credit for home loans, iii) subsidies up to Rs 1.5 lakh to either construct a new house or enhance existing houses on their own and iv) increasing availability of affordable housing units in partnership with the private sector. Since housing is a state subject, there is variation in approach of States towards affordable housing.2
Steps taken by the government with regard to migrant labour during the lockdown
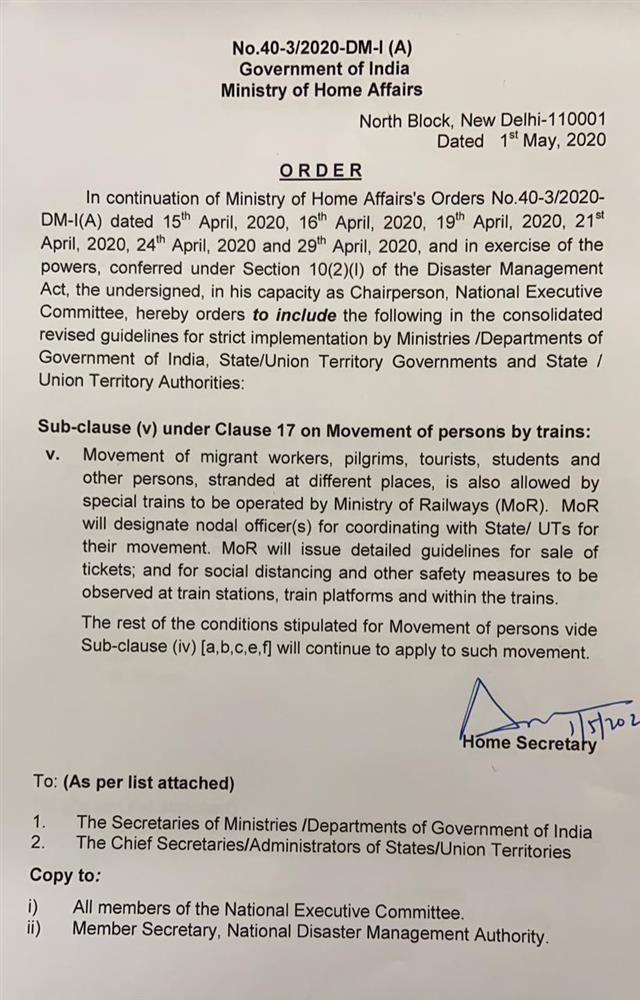
During the lockdown, several inter-state migrant workers tried to return to their home state. Due to the suspension public transport facilities, migrants started walking towards their home state on foot. Subsequently, buses and Shramik special trains were permitted by the central government subject to coordination between states.[3],[4] Between May 1 and June 3, more than 58 lakh migrants were transported through specially operated trains and 41 lakh were transported by road. Measures taken by the government to aid migrants include-
Transport: On March 28, the central government authorised states to use the State Disaster Response Fund to provide accommodation to traveling migrants. States were advised to set up relief camps along highways with medical facilities to ensure people stay in these camps while the lockdown is in place.
In an order issued on April 29, the Ministry of Home Affairs allowed states to co-ordinate individually to transport migrants using buses. On May 1, the Indian Railways resumed passenger movement (for the first time since March 22) with Shramik Special trains to facilitate movement of migrants stranded outside their home state. Between May 1 and June 3, Indian Railways operated 4,197 Shramik trains transporting more than 58 lakh migrants. Top states from where Shramik trains originated are Gujarat and Maharashtra and states where the trains terminated are Uttar Pradesh and Bihar.[5] Note that these trends largely correspond to the migration patterns seen in the 2011 census data.
Food distribution: On April 1, the Ministry of Health and Family Affairs directed state governments to operate relief camps for migrant workers with arrangements for food, sanitation and medical services. On May 14, under the second tranche of the Aatma Nirbhar Bharat Abhiyaan, the Finance Minister announced that free food grains would be provided to migrant workers who do not have a ration card for two months. The measure is expected to benefit eight crore migrant workers and their families. The Finance Minister also announced that One Nation One Ration card will be implemented by March 2021, to provide portable benefits under the PDS. This will allow access to ration from any Fair Price Shop in India.
Housing: The Aatma Nirbhar Bharat Abhiyaan also launched a scheme for Affordable Rental Housing Complexes for Migrant Workers and Urban Poor to provide affordable rental housing units under PMAY. The scheme proposes to use existing housing stock under the Jawaharlal Nehru National Urban Housing Mission (JnNURM) as well as incentivise public and private agencies to construct new affordable units for rent. Further, additional funds have been allocated for the credit linked subsidy scheme under PMAY for middle income group.
Financial aid: Some state governments (like Bihar, Rajasthan and Madhya Pradesh) announced one-time cash transfers for returning migrant workers. UP government announced the provision of maintenance allowance of Rs 1,000 for returning migrants who are required to quarantine.
Directions by the Supreme Court
The Supreme Court reviewed the situation of migrant labourers stranded in different parts of the country, noting inadequacies and lapses in government response to the situation.
[1] Census, 2011, Office of the Registrar General & Census Commissioner, Ministry of Home Affairs.
[2] Report of Working Group on Migration, Ministry of Housing and Urban Poverty Alleviation, January 2017, http://mohua.gov.in/upload/uploadfiles/files/1566.pdf.
[3] Order No. 40-3/2020-DM-I (A), Ministry of Home Affairs, April 29, 2020, https://prsindia.org/files/covid19/notifications/4233.IND_Movement_of_Persons_April_29.pdf.
[4] Order No. 40-3/2020-DM-I (A), Ministry of Home Affairs, May 1, 2020, https://prsindia.org/files/covid19/notifications/IND_Special_Trains_May_1.jpeg.
[5] “Indian Railways operationalizes 4197 “Shramik Special” trains till 3rd June, 2020 (0900hrs) across the country and transports more than 58 lacs passengers to their home states through “Shramik Special” trains since May 1”, Press Information Bureau, Ministry of Railways, June 3, 2020, https://pib.gov.in/PressReleseDetail.aspx?PRID=1629043.

