The percentage of the population living below the poverty line in India decreased to 22% in 2011-12 from 37% in 2004-05, according to data released by the Planning Commission in July 2013. This blog presents data on recent poverty estimates and goes on to provide a brief history of poverty estimation in the country. National and state-wise poverty estimates The Planning Commission estimates levels of poverty in the country on the basis of consumer expenditure surveys conducted by the National Sample Survey Office (NSSO) of the Ministry of Statistics and Programme Implementation.
The current methodology for poverty estimation is based on the recommendations of an Expert Group to Review the Methodology for Estimation of Poverty (Tendulkar Committee) established in 2005. The Committee calculated poverty levels for the year 2004- 05. Poverty levels for subsequent years were calculated on the basis of the same methodology, after adjusting for the difference in prices due to inflation. Table 1 shows national poverty levels for the last twenty years, using methodology suggested by the Tendulkar Committee. According to these estimates, poverty declined at an average rate of 0.74 percentage points per year between 1993-94 and 2004-05, and at 2.18 percentage points per year between 2004-05 and 2011-12. Table 1: National poverty estimates (% below poverty line) (1993 - 2012)
| Year |
Rural |
Urban |
Total |
| 1993 – 94 |
50.1 |
31.8 |
45.3 |
| 2004 – 05 |
41.8 |
25.7 |
37.2 |
| 2009 – 10 |
33.8 |
20.9 |
29.8 |
| 2011 – 12 |
25.7 |
13.7 |
21.9 |
Source: Press Note on Poverty Estimates, 2011 – 12, Planning Commission; Report of the Expert Group to Review the Methodology for Estimation of Poverty (2009) Planning Commission; PRS. State-wise data is also released by the NSSO. Table 2 shows state-wise poverty estimates for 2004-05 and 2011-12. It shows that while there is a decrease in poverty for almost all states, there are wide inter-state disparities in the percentage of poor below the poverty line and the rate at which poverty levels are declining. Table 2: State-wise poverty estimates (% below poverty line) (2004-05, 2011-12)
| State |
2004-05 |
2011-12 |
Decrease |
| Andhra Pradesh |
29.9 |
9.2 |
20.7 |
| Arunachal Pradesh |
31.1 |
34.7 |
-3.6 |
| Assam |
34.4 |
32 |
2.4 |
| Bihar |
54.4 |
33.7 |
20.7 |
| Chhattisgarh |
49.4 |
39.9 |
9.5 |
| Delhi |
13.1 |
9.9 |
3.2 |
| Goa |
25 |
5.1 |
19.9 |
| Gujarat |
31.8 |
16.6 |
15.2 |
| Haryana |
24.1 |
11.2 |
12.9 |
| Himachal Pradesh |
22.9 |
8.1 |
14.8 |
| Jammu and Kashmir |
13.2 |
10.4 |
2.8 |
| Jharkhand |
45.3 |
37 |
8.3 |
| Karnataka |
33.4 |
20.9 |
12.5 |
| Kerala |
19.7 |
7.1 |
12.6 |
| Madhya Pradesh |
48.6 |
31.7 |
16.9 |
| Maharashtra |
38.1 |
17.4 |
20.7 |
| Manipur |
38 |
36.9 |
1.1 |
| Meghalaya |
16.1 |
11.9 |
4.2 |
| Mizoram |
15.3 |
20.4 |
-5.1 |
| Nagaland |
9 |
18.9 |
-9.9 |
| Odisha |
57.2 |
32.6 |
24.6 |
| Puducherry |
14.1 |
9.7 |
4.4 |
| Punjab |
20.9 |
8.3 |
12.6 |
| Rajasthan |
34.4 |
14.7 |
19.7 |
| Sikkim |
31.1 |
8.2 |
22.9 |
| Tamil Nadu |
28.9 |
11.3 |
17.6 |
| Tripura |
40.6 |
14.1 |
26.5 |
| Uttar Pradesh |
40.9 |
29.4 |
11.5 |
| Uttarakhand |
32.7 |
11.3 |
21.4 |
| West Bengal |
34.3 |
20 |
14.3 |
| All Inda |
37.2 |
21.9 |
15.3 |
Source: Review of Expert Group to Review the Methodology for Estimation of Poverty (2009) Planning Commission, Government of India; Press Note on Poverty Estimates, 2011 – 12 (2013) Planning Commission, Government of India; PRS. Note: A negative sign before the number in column four (decrease) indicates an increase in percentage of population below the poverty line. History of poverty estimation in India Pre independence poverty estimates: One of the earliest estimations of poverty was done by Dadabhai Naoroji in his book, ‘Poverty and the Un-British Rule in India’. He formulated a poverty line ranging from Rs 16 to Rs 35 per capita per year, based on 1867-68 prices. The poverty line proposed by him was based on the cost of a subsistence diet consisting of ‘rice or flour, dhal, mutton, vegetables, ghee, vegetable oil and salt’. Next, in 1938, the National Planning Committee (NPC) estimated a poverty line ranging from Rs 15 to Rs 20 per capita per month. Like the earlier method, the NPC also formulated its poverty line based on ‘a minimum standard of living perspective in which nutritional requirements are implicit’. In 1944, the authors of the ‘Bombay Plan’ (Thakurdas et al 1944) suggested a poverty line of Rs 75 per capita per year. Post independence poverty estimates: In 1962, the Planning Commission constituted a working group to estimate poverty nationally, and it formulated separate poverty lines for rural and urban areas – of Rs 20 and Rs 25 per capita per year respectively. VM Dandekar and N Rath made the first systematic assessment of poverty in India in 1971, based on National Sample Survey (NSS) data from 1960-61. They argued that the poverty line must be derived from the expenditure that was adequate to provide 2250 calories per day in both rural and urban areas. This generated debate on minimum calorie consumption norms while estimating poverty and variations in these norms based on age and sex. Alagh Committee (1979): In 1979, a task force constituted by the Planning Commission for the purpose of poverty estimation, chaired by YK Alagh, constructed a poverty line for rural and urban areas on the basis of nutritional requirements. Table 3 shows the nutritional requirements and related consumption expenditure based on 1973-74 price levels recommended by the task force. Poverty estimates for subsequent years were to be calculated by adjusting the price level for inflation. Table 3: Minimum calorie consumption and per capita consumption expenditure as per the 1979 Planning Commission task force on poverty estimation
| Area | Calories | Minimum consumption expenditure (Rs per capita per month) |
| Rural | 2400 | 49.1 |
| Urban | 2100 | 56.7 |
Source: Report of the Expert Group on Estimation of Proportion and Number of Poor, 1993, Perspective Planning Division, Planning Commission; PRS Lakdawala Committee (1993): In 1993, an expert group constituted to review methodology for poverty estimation, chaired by DT Lakdawala, made the following suggestions: (i) consumption expenditure should be calculated based on calorie consumption as earlier; (ii) state specific poverty lines should be constructed and these should be updated using the Consumer Price Index of Industrial Workers (CPI-IW) in urban areas and Consumer Price Index of Agricultural Labour (CPI-AL) in rural areas; and (iii) discontinuation of ‘scaling’ of poverty estimates based on National Accounts Statistics. This assumes that the basket of goods and services used to calculate CPI-IW and CPI-AL reflect the consumption patterns of the poor. Tendulkar Committee (2009): In 2005, another expert group to review methodology for poverty estimation, chaired by Suresh Tendulkar, was constituted by the Planning Commission to address the following three shortcomings of the previous methods: (i) consumption patterns were linked to the 1973-74 poverty line baskets (PLBs) of goods and services, whereas there were significant changes in the consumption patterns of the poor since that time, which were not reflected in the poverty estimates; (ii) there were issues with the adjustment of prices for inflation, both spatially (across regions) and temporally (across time); and (iii) earlier poverty lines assumed that health and education would be provided by the State and formulated poverty lines accordingly.[1] It recommended four major changes: (i) a shift away from calorie consumption based poverty estimation; (ii) a uniform poverty line basket (PLB) across rural and urban India; (iii) a change in the price adjustment procedure to correct spatial and temporal issues with price adjustment; and (iv) incorporation of private expenditure on health and education while estimating poverty. The Committee recommended using Mixed Reference Period (MRP) based estimates, as opposed to Uniform Reference Period (URP) based estimates that were used in earlier methods for estimating poverty.[2] It based its calculations on the consumption of the following items: cereal, pulses, milk, edible oil, non-vegetarian items, vegetables, fresh fruits, dry fruits, sugar, salt & spices, other food, intoxicants, fuel, clothing, footwear, education, medical (non-institutional and institutional), entertainment, personal & toilet goods, other goods, other services and durables. The Committee computed new poverty lines for rural and urban areas of each state. To do this, it used data on value and quantity consumed of the items mentioned above by the population that was classified as poor by the previous urban poverty line. It concluded that the all India poverty line was Rs 446.68 per capita per month in rural areas and Rs 578.80 per capita per month in urban areas in 2004-05. The following table outlines the manner in which the percentage of population below the poverty line changed after the application of the Tendulkar Committee’s methodology. Table 4: Percentage of population below poverty line calculated by the Lakdawala Committee and the Tendulkar Committee for the year 2004-05
| Committee |
Rural |
Urban |
Total |
| Lakdawala Committee |
28.3 |
25.7 |
27.5 |
| Tendulkar Committee |
41.8 |
27.5 |
37.2 |
Source: Report of the Expert Group on Estimation of Proportion and Number of Poor, 1993, Perspective Planning Division, Planning Commission; Report of the Expert Group to Review the Methodology for Estimation of Poverty, 2009, Planning Commission; PRS The Committee also recommended a new method of updating poverty lines, adjusting for changes in prices and patterns of consumption, using the consumption basket of people close to the poverty line. Thus, the estimates released in 2009-10 and 2011-12 use this method instead of using indices derived from the CPI-AL for rural areas and CPI-IW for urban areas as was done earlier. Table 5 outlines the poverty lines computed using the Tendulkar Committee methodology for the years 2004-05, 2009-10 and 2011-12. Table 5: National poverty lines (in Rs per capita per month) for the years 2004-05, 2009-10 and 2011-12
| Year |
Rural |
Urban |
| 2004-05 |
446.7 |
578.8 |
| 2009-10 |
672.8 |
859.6 |
| 2011-12 |
816.0 |
1000.0 |
Source: Report of the Expert Group to Review the Methodology for Estimation of Poverty (2009) Planning Commission; Poverty Estimates 2009-10 and Poverty Estimates 2011-12, Planning Commission; PRS Rangarajan Committee: In 2012, the Planning Commission constituted a new expert panel on poverty estimation, chaired by C Rangarajan with the following key objectives: (i) to provide an alternate method to estimate poverty levels and examine whether poverty lines should be fixed solely in terms of a consumption basket or if other criteria are also relevant; (ii) to examine divergence between the consumption estimates based on the NSSO methodology and those emerging from the National Accounts aggregates; (iii) to review international poverty estimation methods and indicate whether based on these, a particular method for empirical poverty estimation can be developed in India, and (iv) to recommend how these estimates of poverty can be linked to eligibility and entitlements under the various schemes of the Government of India. The Committee is expected to submit its report by 2014.
[1] While private expenditure on education and health was covered in the base year 1973-74, no account was taken of either the increase in the proportion of these in total expenditure over time or of their proper representation in available price indices.
[2] Under the URP method, respondents are asked to detail consumption over the previous 30 days; whereas under the MRP method five low-frequency items (clothing, footwear, durables, education and institutional health expenditure) are surveyed over the previous 365 days, and all other items over the previous 30 days.
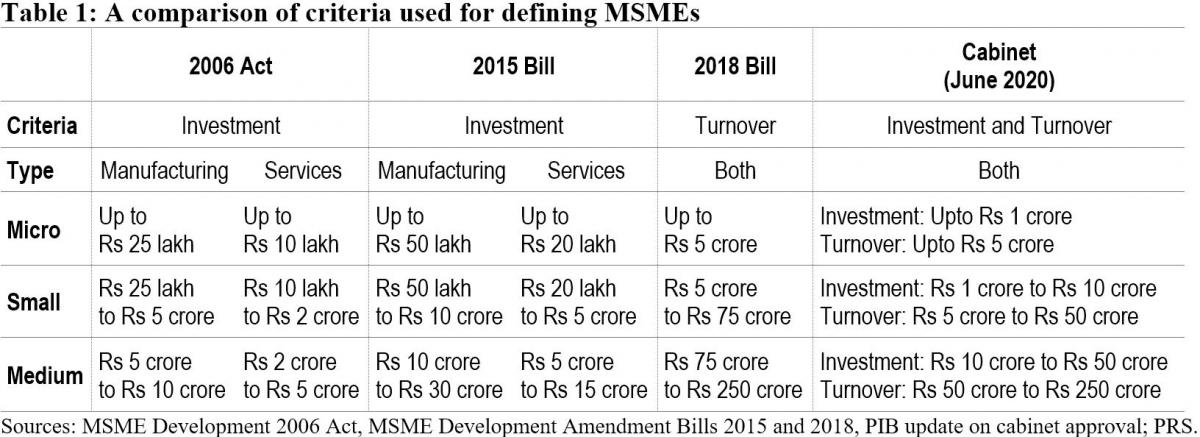
On June 1, 2020, the Cabinet Committee on Economic Affairs approved a revision in the definition of Micro, Small and Medium Enterprises (MSMEs).[1] In this blog, we discuss the change in the definition as approved by the Cabinet, and examine some of the common criteria used for classification of MSMEs.
Currently, MSMEs are defined under the Micro, Small and Medium Enterprises Development Act, 2006.[2] The Act classifies them as micro, small and medium enterprises based on: (i) investment in plant and machinery for enterprises engaged in manufacturing or production of goods, and (ii) investment in equipment for enterprises providing services. As per the Cabinet approval, the investment limits will be revised upwards and annual turnover of the enterprise will be used as additional criteria for the classification of MSMEs (Table 1).
Earlier attempts to amend the definition of MSMEs
The central government has sought to revise the definition of MSMEs in the Act on two earlier occasions. The government introduced the MSME Development (Amendment) Bill, 2015 which proposed to increase the investment limits for manufacturing and services MSMEs.[3] This Bill was withdrawn in July 2018 and another Bill was introduced. The MSME Development (Amendment) Bill, 2018 proposed to: (i) use annual turnover as criteria instead of investment for classification of MSMEs, (ii) remove the distinction between manufacturing and services, and (iii) provide the central government with the power to revise the turnover limits, through a notification.[4] The 2018 Bill lapsed with the dissolution of 16th Lok Sabha.
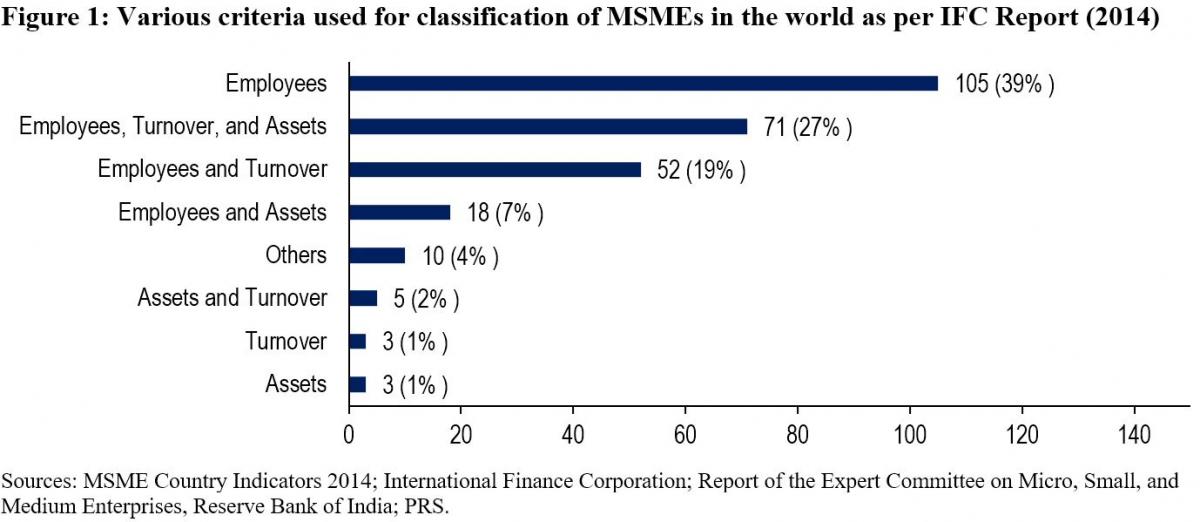
Global trends in criteria for the classification of MSMEs
While India will now be using investment and annual turnover as the criteria to classify MSMEs, globally, the number of employees is the most widely used criteria for classifying MSMEs. The Reserve Bank of India's Expert Committee on MSMEs (2019) cited a study by the International Finance Corporation in 2014 which analysed 267 definitions used by different institutions in 155 countries.[5],[6] According to the study, countries used a combination of criteria to classify MSMEs. 92% of the definitions used the number of employees as one of the criteria. Other frequently used criteria were: (i) turnover (49%), and (ii) value of assets (36%). 11% of the analysed definitions used alternative criteria such as: (i) loan size, (ii) years of experience, and (iii) initial investment.
Evaluation of common criteria used to define MSMEs
Investment: The 2006 Act uses investment in plant, machinery, and equipment to classify MSMEs. Some of the issues with the investment criteria include:
Due to their informal and small scale of operations, firms often do not maintain proper books of accounts and hence find it difficult to get classified as MSMEs as per the current definition.5
The investment-based classification incentivises promoters to keep the investment size restricted to retain the benefits associated with the micro or small category.7
Turnover: The 2018 Bill sought to replace the investment criteria with annual turnover as the sole criteria for the classification of MSMEs. The Standing Committee agreed with the proposal under the Bill to use annual turnover as the criteria instead of investment.7 It observed that this could overcome some of the shortcomings of classification based on investment. While turnover based criteria will also require verification, the Committee noted that the GST Network (GSTN) data can act as a reliable source of information for this purpose. However, it also observed that:7
With turnover as a criterion for classification, corporates may misuse the incentives meant for MSMEs. For instance, there is a possibility that a multi-national company may produce a large quantity of products worth a high turnover and then market it through various subsidiaries registered as Micro or Small enterprise under GSTN.
The turnover of some enterprises may fluctuate depending on their business, which may result in the change of classification of the enterprise during a year.
The Committee noted that there is a wide gap in turnover limits. For instance, an enterprise with a turnover of Rs 6 crore and an enterprise with a turnover of Rs 75 crore (as proposed in 2018 Bill) would both be classified as a small enterprise, which seems incongruous.
The Expert Committee (RBI) also recommended using annual turnover as the criteria for classification instead of investment.5 It observed that turnover based definition would be transparent, progressive, and easier to implement through the GSTN. It also recommended that the power to change the definition of MSMEs should be delegated to the executive as it will help in responding to changing economic scenarios.
Number of employees: The Standing Committee had highlighted that in a labour-intensive country like India, appropriate focus is required on employment generation and MSME sector is the most suitable platform for this.7 It had recommended that the central government should assess the number of persons employed in the MSME sector and also consider employment as a criterion while classifying MSMEs. However, the Expert Committee (RBI) stated that while the employment-based definition is an additional feature preferred in some countries, the definition would pose challenges in implementation.5 According to the Ministry of MSME, employment as a criterion has problems due to: (i) factors such as seasonality and informal nature of engagement, (ii) similar to investment criteria, this would also require physical verification and has associated cost overheads.7
Number of MSMEs
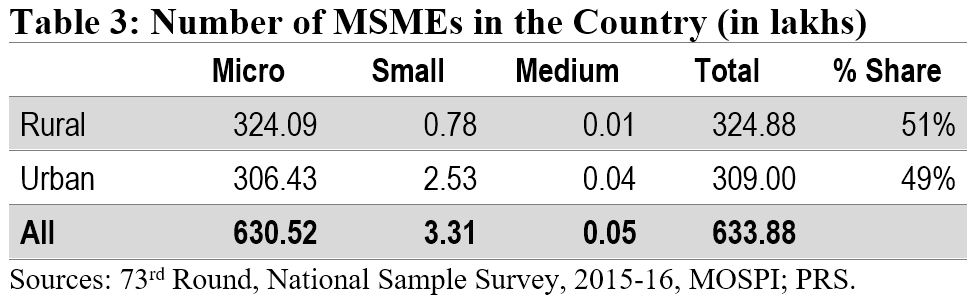
According to the National Sample Survey (2015-16), there were around 6.34 crore MSMEs in the country. The micro sector with 6.3 crore enterprises accounted for more than 99% of the total estimated number of MSMEs. The small and medium sectors accounted for only 0.52% and 0.01% of the estimated number of enterprises, respectively. Another dataset to understand the distribution of MSMEs is Udyog Aadhaar, a unique identity provided by the Unique Identification Authority of India (UIDAI) to MSME enterprises.[8] Udyog Aadhaar registration is based on self-declaration by enterprises. Between September 2015 and June 2020, 98.6 lakh enterprises have registered with UIDAI. According to this dataset, micro, small, and medium enterprises comprise 87.7%, 11.8% and 0.5% of the MSME sector respectively.
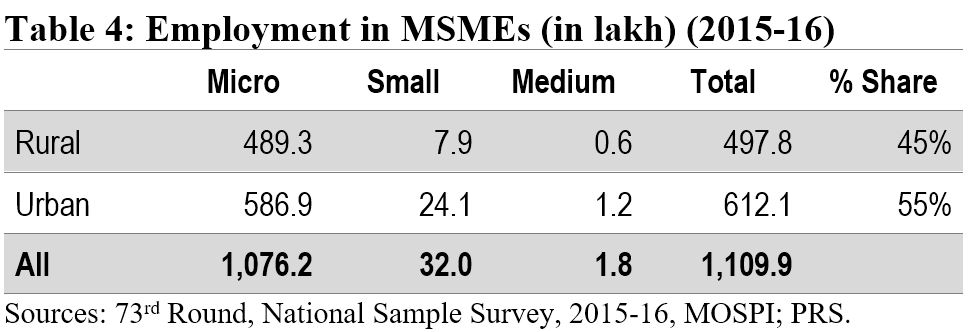
Employment in the MSME sector
The MSME sector employed nearly 11.1 crore people in 2015-16. The sector was the second largest employer after the agriculture sector. The highest number of employed persons were engaged in trade activity (35%), followed by persons engaged in manufacturing (32%).
Implications of change in the definition of MSMEs
The change in the definition of MSMEs may result in many enterprises which are currently classified as Small enterprises be reclassified as Micro, and those classified as Medium enterprises be reclassified as Small. Further, there may be many enterprises which are not currently classified as MSMEs, which may fall under the MSME classification as per the new definition. Such enterprises will also now benefit from the schemes related to MSMEs. The Ministry of MSME runs various schemes to provide for: (i) flow of credit to MSMEs, (ii) support for technology upgrade and modernisation, (iii) entrepreneurship and skill development, and (iv) cluster-wise measures to promote capacity-building and empowerment of MSME units. For instance, under the Credit Guarantee Fund Scheme for Micro and Small Enterprises, a credit guarantee cover of up to 75% of the credit is provided to micro and small enterprises.[9] Thus, the re-classification may require a significant increase in budgetary allocation for the MSME sector.
Other announcements related to MSMEs in the aftermath of COVID-19
MSME sector accounted for nearly 33.4% of the total manufacturing output in 2017-18.[10] During the same year, its share in the country’s total exports was around 49%. Between 2015 and 2017, the contribution of the sector in GDP has been around 30%. Due to the national lockdown induced by COVID-19, businesses including MSMEs have been badly hit. To provide immediate relief to the MSME sector, the government announced several measures in May 2020.[11] These include: (i) collateral-free loans for MSMEs with up to Rs 25 crore outstanding and up to Rs 100 crore turnover, (ii) Rs 20,000 crore as subordinate debt for stressed MSMEs, and (iii) Rs 50,000 crore of capital infusion into MSMEs. These measures have also been approved by the Union Cabinet.[12]
For more details on the announcements made under the Aatma Nirbhar Bharat Abhiyan, see here.
[1] “Cabinet approves Upward revision of MSME definition and modalities/ road map for implementing remaining two Packages for MSMEs (a)Rs 20000 crore package for Distressed MSMEs and (b) Rs 50,000 crore equity infusion through Fund of Funds”, Press Information Bureau, Cabinet Committee on Economic Affairs, June 1, 2020.
[2] The Micro, Small and Medium Enterprises Development Act, 2006, https://samadhaan.msme.gov.in/WriteReadData/DocumentFile/MSMED2006act.pdf.
[3] The Micro, Small and Medium Enterprises Development (Amendment) Bill, 2015, https://www.prsindia.org/sites/default/files/bill_files/MSME_bill%2C_2015_0.pdf.
[4] The Micro, Small and Medium Enterprises Development (Amendment) Bill, 2018, https://www.prsindia.org/sites/default/files/bill_files/The%20Micro%2C%20Small%20and%20Medium%20Enterprises%20Development%20%28Amendment%29%20Bill%2C%202018%20Bill%20Text.pdf.
[5] Report of the Expert Committee on Micro, Small and Medium Enterprises, The Reserve Bank of India, July 2019, https://rbidocs.rbi.org.in/rdocs/PublicationReport/Pdfs/MSMES24062019465CF8CB30594AC29A7A010E8A2A034C.PDF.
[6] MSME Country Indicators 2014, International Finance Corporation, December 2014, https://www.smefinanceforum.org/sites/default/files/analysis%20note.pdf.
[7] 294th Report on Micro Small and Medium Enterprises Development (Amendment) Bill 2018, Standing Committee on Industry, Rajya Sabha, December 2018, https://rajyasabha.nic.in/rsnew/Committee_site/Committee_File/ReportFile/17/111/294_2019_3_15.pdf.
[8] Enterprises with Udyog Aadhaar Number, National Portal for Registration of Micro, Small & Medium Enterprises, Ministry of Micro, Small and Medium Enterprises, https://udyogaadhaar.gov.in/UA/Reports/StateBasedReport_R3.aspx.
[9] Credit Guarantee Fund Scheme for Micro and Small Enterprises, Ministry of Micro, Small and Medium Enterprises, http://www.dcmsme.gov.in/schemes/sccrguarn.htm.
[10] Annual Report 2018-19, Ministry of Micro, Small and Medium Enterprises, https://msme.gov.in/sites/default/files/Annualrprt.pdf.
[11] "Finance Minister announce measures for relief and credit support related to businesses, especially MSMEs to support Indian Economy’s fight against COVID-19", Press Information Bureau, Ministry of Finance, May 13, 2020.
[12] "Cabinet approves additional funding of up to Rupees three lakh crore through introduction of Emergency Credit Line Guarantee Scheme (ECLGS)", Press Information Bureau, Ministry of Finance, May 20, 2020.

