The National Education Policy (NEP) 2020 was released on July 30, 2020. It will replace the National Policy on Education, 1986. Key recommendations of the NEP include: (i) redesigning the structure of school curriculum to incorporate early childhood care and education, (ii) curtailing dropouts for ensuring universal access to education, (iii) increasing gross enrolment in higher education to 50% by 2035, and (iv) improving research in higher education institutes by setting up a Research Foundation. In this blog, we examine the current status of education in the country in view of some of these recommendations made by the NEP.
Universal access to Education
The NEP states that the Right to Education Act, 2009 has been successful in achieving near universal enrolment in elementary education, however retaining children remains a challenge for the schooling system. As of 2015-16, Gross Enrolment Ratio was 56.2% at senior secondary level as compared to 99.2% at primary level. GER denotes enrolment as a percent of the population of corresponding age group. Further, it noted that the decline in GER is higher for certain socio-economically disadvantaged groups, based on: (i) gender identities (female, transgender persons), (ii) socio-cultural identities (scheduled castes, scheduled tribes), (iii) geographical identities (students from small villages and small towns), (iv) socio-economic identities (migrant communities and low income households), and (v) disabilities. In the table below, we detail the GER in school education across: (i) gender, and (ii) socio-cultural identities.
Table 1: GER in school education for different gender and social groups (2015-16)
|
Level |
Male |
Female |
SC |
ST |
All |
|
Primary (I-V) |
97.9% |
100.7% |
110.9% |
106.7% |
99.2% |
|
Upper Primary (VI-VIII) |
88.7% |
97.6% |
102.4% |
96.7% |
92.8% |
|
Secondary (IX-X) |
79.2% |
81% |
85.3% |
74.5% |
80% |
|
Senior Secondary (XI-XII) |
56% |
56.4% |
56.8% |
43.1% |
56.2% |
Sources: Educational Statistics at Glance 2018, MHRD; PRS.
Data for all groups indicates decline in GER as we move from primary to senior secondary for all groups. This decline is particularly high in case of Scheduled Tribes. Further, we analyse the reason for dropping out from school education. Data suggests that the most prominent reason for dropping out was: engagement in domestic activities (for girls) and engagement in economic activities (for boys).
Table 2: Major reasons for dropping out (Class 1-12) for 2015-16
|
Reason for dropping out |
Male |
Female |
|
Child not interested in studies |
23.8% |
15.6% |
|
Financial Constraints |
23.7% |
15.2% |
|
Engage in Domestic Activities |
4.8% |
29.7% |
|
Engage in Economic Activities |
31.0% |
4.9% |
|
School is far off |
0.5% |
3.4% |
|
Unable to cop-up with studies |
5.4% |
4.6% |
|
Completed desired level/ Class |
5.7% |
6.5% |
|
Marriage |
|
13.9% |
|
Other reasons |
5.1% |
6.2% |
Note: Other reasons include: (i) timings of educational Institution not suitable, (ii) language/medium of Instruction used unfamiliar, (iii) inadequate number of teachers, (iv) quality of teachers not satisfactory, (v) unfriendly atmosphere at school. For girl students, other reasons also include: (i) non-availability of female teachers, (ii) non-availability of girl’s toilet.
Sources: Educational Statistics at Glance 2018, MHRD; PRS.
The NEP recommends strengthening of existing schemes and policies which are targeted for such socio-economically disadvantaged groups (for instance, schemes for free bicycles for girls or scholarships) to tackle dropouts. Further, it recommends setting up special education zones in areas with significant proportion of such disadvantaged groups. A gender inclusion fund should also be setup to assist female and transgender students in getting access to education.
Increasing GER in Higher Education to 50% by 2035
The NEP aims to increase the GER in higher education to 50% by 2035. As of 2018-19, the GER in higher education in the country stood at 26.3%. Figure 2 shows the trend of GER in higher education over the last few years. Note that the annual growth rate of GER in higher education in the last few years has been around 2%.
Figure 1: GER in Higher Education (2014-15 to 2018-19)

Sources: All India Survey on Higher Education, MHRD; PRS.
Table 3: Comparison of GER (higher education) with other countries
|
Country |
GER (2017-18) |
|
India |
25% |
|
Brazil |
51% |
|
China |
49% |
|
Indonesia |
36% |
|
South Africa |
22% |
|
Pakistan |
9% |
|
Germany |
70% |
|
France |
66% |
|
United Kingdom |
60% |
Sources: UNESCO; PRS.
The NEP recommends that for increasing GER, capacity of existing higher education institutes will have to be improved by restructuring and expanding existing institutes. It recommends that all institutes should aim to be large multidisciplinary institutes (with enrolments in thousands), and there should be one such institution in or near every district by 2030. Further, institutions should have the option to run open distance learning and online programmes to improve access to higher education.
Foundational literacy and numeracy
The NEP states that a large proportion of the students currently enrolled in elementary school have not attained foundational literacy and numeracy (the ability to read and understand basic text, and carry out basic addition and subtraction). It recommends that every child should attain foundational literacy and numeracy by grade three.
Table 4 highlights the results of the National Achievement Survey 2017 on the learning levels of students at Grade 3 in language and mathematics. The results of the survey suggest that only 57% students in Grade 3 are able to solve basic numeracy skills related to addition and subtraction.
Table 4: NAS results on learning level of Grade-3 students
|
Learning level (Grade 3) |
Percentage of students |
|
Ability to read small texts with comprehension (Language) |
68% |
|
Ability to read printed scripts on classroom walls such as poems, posters (Language) |
65% |
|
Solving simple daily life addition and subtraction problems with 3 digits (Mathematics) |
57% |
|
Analyses and applies the appropriate number operation in a situation (Mathematics) |
59% |
Sources: National Achievement Survey (2017) dashboard, NCERT; PRS.
To achieve universal foundational literacy and numeracy, the Policy recommends setting up a National Mission on Foundational Literacy and Numeracy under the MHRD. All state governments must prepare implementation plans to achieve these goals by 2025. A national repository of high-quality resources on foundational literacy and numeracy will be made available on government’s e-learning platform (DIKSHA). Other measures to be taken in this regard include: (i) filling teacher vacancies at the earliest, (ii) ensuring a pupil to teacher ratio of 30:1 for effective teaching, and (iii) training teachers to impart foundational literacy and numeracy.
Effective governance of schools
The Policy states that establishing primary schools in every habitation across the country has helped increase access to education. However, it has led to the development of schools with low number of students. The small size of schools makes it operationally and economically challenging to deploy teachers and critical physical resources (such as library books, sports equipment).
With respect to this observation, the distribution of schools by enrolment size can be seen in the table below. Note that, as of September 2016, more than 55% of primary schools in the country had an enrolment below 60 students.
Table 5: Distribution of schools by enrolment size
|
Strength (Grade) |
Below 30 |
31-60 |
61-90 |
91-120 |
121-150 |
151-200 |
More than 200 |
|
Primary schools (Class 1-5) |
28.0% |
27.5% |
16.0% |
10.3% |
6.3% |
5.6% |
6.4% |
|
Upper primary schools (Class 6-8) |
14.8% |
27.9% |
18.7% |
15.0% |
8.4% |
7.2% |
8.0% |
|
Upper primary schools (Class 1-8) |
5.7% |
11.6% |
13.0% |
12.1% |
10.4% |
13.4% |
33.8% |
Sources: Flash Statistics on School Education 2016-17, UDISE; PRS.
While nearly 80% primary schools had a library, only 1.5% schools had a librarian (as of September 2016). The availability of facilities is better in higher senior secondary schools as compared to primary or upper primary schools.
Table 6: Distribution of schools with access to physical facilities
|
Facilities |
Primary schools (Class 1-5) |
Upper primary schools (Class 1-8) |
Higher senior secondary |
|
Library |
79.8% |
88.0% |
94.4% |
|
Librarian |
1.5% |
4.5% |
34.4% |
|
Playground |
54.9% |
65.5% |
84.3% |
|
Functional computer |
4.4% |
25.2% |
46.0% |
|
Internet connection |
0.9% |
4.2% |
67.9% |
Sources: Flash Statistics on School Education 2016-17, UDISE; PRS.
To overcome the challenges associated with development of small schools, the NEP recommends grouping schools together to form a school complex. The school complex will consist of one secondary school and other schools, aanganwadis in a 5-10 km radius. This will ensure: (i) adequate number of teachers for all subjects in a school complex, (ii) adequate infrastructural resources, and (iii) effective governance of schools.
Restructuring of Higher Education Institutes
The NEP notes that the higher education ecosystem in the country is severely fragmented. The present complex nomenclature of higher education institutes (HEIs) in the country such as ‘deemed to be university’, ‘affiliating university’, ‘affiliating technical university', ‘unitary university’ shall be replaced simply by 'university'.
According to the All India Survey on Higher Education 2018-19, India has 993 universities, 39,931 colleges, and 10,725 stand-alone institutions (technical institutes such as polytechnics or teacher training institutes).
Table 7: Number of Universities in India according to different categories
|
Type of university |
Number of universities |
|
Central University |
46 |
|
Central Open University |
1 |
|
Institutes of National Importance |
127 |
|
State Public University |
371 |
|
Institution Under State Legislature Act |
5 |
|
State Open University |
14 |
|
State Private University |
304 |
|
State Private Open University |
1 |
|
Deemed University- Government |
34 |
|
Deemed University- Government Aided |
10 |
|
Deemed University- Private |
80 |
|
Total |
993 |
Sources: All India Survey on Higher Education 2018-19; PRS.
The NEP recommends that all HEIs should be restructured into three categories: (i) research universities focusing equally on research and teaching, (ii) teaching universities focusing primarily on teaching, and (iii) degree granting colleges primarily focused on undergraduate teaching. All such institutions will gradually move towards full autonomy - academic, administrative, and financial.
Setting up a National Research Foundation to boost research
The NEP states that investment on research and innovation in India, at only 0.69% of GDP, lags behind several other countries. India’s expenditure on research and development (R&D) in the last few years can be seen in the figure below. Note that the total investment on R&D in India as a proportion of GDP has been stagnant at around 0.7% of GDP. In 2018-19, the total expenditure on R&D in India was Rs 1,23,848 crore. Of this, Rs 72,732 crore (58%) of expenditure was by government, and the remaining (42%) was by private industry.
Figure 2: R&D Expenditure in India (2011-12 to 2018-19)

Sources: S&T Indicators Table 2019-20, Ministry of Science and Technology, March 2020; PRS.
Figure 3: Comparison of R&D expenditure in India with other countries (2017)

Sources: S&T Indicators Table 2019-20, Ministry of Science and Technology, March 2020; PRS.
To boost research, the NEP recommends setting up an independent National Research Foundation (NRF) for funding and facilitating quality research in India. The Foundation will act as a liaison between researchers and relevant branches of government as well as industry. Specialised institutions which currently fund research, such as the Department of Science and Technology, and the Indian Council of Medical Research, will continue to fund independent projects. The Foundation will collaborate with such agencies to avoid duplication.
Digital education
The NEP states that alternative modes of quality education should be developed when in-person education is not possible, as observed during the recent pandemic. Several interventions must be taken to ensure inclusive digital education such as: (i) developing two-way audio and video interfaces for holding online classes, and (ii) use of other channels such as television, radio, mass media in multiple languages to ensure reach of digital content where digital infrastructure is lacking.
In this context, we analyse: (i) the availability of computer and internet across households in India, and (ii) ability to use computer or internet by persons in the age group of 5-14. As of 2017-18, the access to internet and computer was relatively poor in rural areas. Only 4.4% of rural households have access to a computer (excludes smartphones), and nearly 15% have access to internet facility. Amongst urban households, 42% have access to internet.
Table 8: Access to Computer and Internet across households (2017-18)
|
Access to ICT |
Rural |
Urban |
Overall |
|
Households having computer |
4.4% |
23.4% |
10.7% |
|
Households having internet facility |
14.9% |
42.0% |
23.8% |
Note: Computer includes desktop, laptop, notebook, tablet. It does not include smartphone.
Sources: Household Social Consumption on Education (2017-18), Ministry of Statistics and Programme Implementation, July 2020; PRS.
Table 9: Ability to use Computer and Internet across persons in the age group 5-14 (2017-18)
|
Ability to use ICT |
Rural |
Urban |
Overall |
|
Ability to use computer |
5.1% |
21.3% |
9.1% |
|
Ability to use internet |
5.1% |
19.7% |
8.8% |
Note: Ability to use computer means to be able to carry out any of the tasks such as: (i) copying or moving a file/folder, (ii) sending emails, (iii) transferring files between a computer and other devices, among others. Ability to use internet means to be able to use the internet browser for website navigation, using e-mail or social networking applications.
Sources: Household Social Consumption on Education (2017-18), Ministry of Statistics and Programme Implementation, July 2020; PRS.
Public spending on education to be increased to 6% of GDP
The recommendation of increasing public spending on Education to 6% of GDP was first made by the National Policy on Education 1968 and reiterated by the 1986 Policy. NEP 2020 reaffirms the recommendation of increasing public spending on education to 6% of GDP. In 2017-18, the public spending on education (includes spending by centre and states) was budgeted at 4.43% of GDP.
Table 10: Public spending on Education (2013-2018)
|
Year |
Public expenditure (Rs crore) |
% of GDP |
|
2013-14 |
4,30,879 |
3.84% |
|
2014-15 |
5,06,849 |
4.07% |
|
2015-16 |
5,77,793 |
4.20% |
|
2016-17 |
6,64,265 |
4.32% |
|
2017-18 |
7,56,945 |
4.43% |
Sources: 312th Report, Standing Committee on Human Resource Development, March 2020; PRS.
Figure 4: Comparison of public spending on Education in India with other countries as % of GDP (2015)

Sources: Educational Statistics at Glance 2018, MHRD; PRS.
In the figure below, we look at the disparities within states in education spending. In 2020-21, states in India have allocated 15.7% of their budgeted expenditure towards education. States such as Delhi, Rajasthan, and Maharashtra have allocated more than 18% of their expenditure on Education for the year 2020-21. On the other hand, Telangana (7.4%), Andhra Pradesh (12.1%) and Punjab (12.3%) lack in spending on education, as compared to the average of states.
Figure 5: Budgeted allocation on Education (2020-21) by states in India

Note: AP is Andhra Pradesh, UP is Uttar Pradesh, HP is Himachal Pradesh and WB is West Bengal.
Sources: Analysis of various state budget documents; PRS.
For a detailed summary of the National Education Policy, see here.
India has been in lockdown since March 25, 2020. During this time, activities not contributing to the production and supply of essential goods and services were completely or partially suspended. Passenger trains and flights were halted. The lockdown has severely impacted migrants, several of whom lost their jobs due to shutting of industries and were stranded outside their native places wanting to get back. Since then, the government has announced relief measures for migrants, and made arrangements for migrants to return to their native place. The Supreme Court of India, recognising the problems faced by migrants stranded in different parts of the country, reviewed transportation and relief arrangements made by the government. On June 9, the Court directed central and state governments to complete transportation of remaining stranded migrants and expand focus of relief measures to facilitate employment for returning migrants. In this blog, we highlight some facts about migration in India, summarise key relief measures announced by the government and directives issued by the Supreme Court for the migrant population in relation to the lockdown.
Overview of Migration
Migration is the movement of people away from their usual place of residence, across either internal (within country) or international (across countries) borders. The latest government data on migration comes from the 2011 Census. As per the Census, India had 45.6 crore migrants in 2011 (38% of the population) compared to 31.5 crore migrants in 2001 (31% of the population). Between 2001 and 2011, while population grew by 18%, the number of migrants increased by 45%. In 2011, 99% of total migration was internal and immigrants (international migrants) comprised 1%.[1]
Patterns of migration
Internal migrant flows can be classified on the basis of origin and destination. One kind of classification is: i) rural-rural, ii) rural-urban, iii) urban-rural and iv) urban-urban. As per the 2011 census, there were 21 crore rural-rural migrants which formed 54% of classifiable internal migration (the Census did not classify 5.3 crore people as originating from either rural or urban areas). Rural-urban and urban-urban movement accounted for around 8 crore migrants each. There were around 3 crore urban-rural migrants (7% of classifiable internal migration).
Another way to classify migration is: (i) intra-state, and (ii) inter-state. In 2011, intra-state movement accounted for almost 88% of all internal migration (39.6 crore persons).1
There is variation across states in terms of inter-state migration flows. According to the 2011 Census, there were 5.4 crore inter-state migrants. As of 2011, Uttar Pradesh and Bihar were the largest source of inter-state migrants while Maharashtra and Delhi were the largest receiver states. Around 83 lakh residents of Uttar Pradesh and 63 lakh residents of Bihar had moved either temporarily or permanently to other states. Around 60 lakh people from across India had migrated to Maharashtra by 2011.
Figure 1: Inter-state Migration (in lakh)

Note: A net out-migrant state is one where more people migrate out of the state than those that migrate into the state. Net in-migration is the excess of incoming migrants over out-going migrants.
Sources: Census 2011; PRS.
Reasons for internal migration and size of migrant labour force
As of 2011, majority (70%) of intra-state migration was due to reasons of marriage and family with variation between male and female migrants. While 83% of females moved for marriage and family, the corresponding figure for males was 39%. Overall, 8% of people moved within a state for work (21% of male migrants and 2% of female migrants).
Movement for work was higher among inter-state migrants- 50% of male and 5% of female inter-state migrants. As per the Census, there were 4.5 crore migrant workers in 2011. However, according to the Working Group Report on Migration, the Census underestimates the migrant worker population. Female migration is recorded as movement due to family since that is the primary reason. However, many women take up employment after migrating which is not reflected in the number of women moving for work-related reasons. [2]
According to the Economic Survey, 2016-17, Census data also underestimates temporary migrant labour movement. In 2007-08, the NSSO estimated the size of India’s migrant labour at seven crore (29% of the workforce). The Economic Survey, 2016-17, estimated six crore inter-state labour migrants between 2001-2011. The Economic Survey also estimated that in each year between 2011-2016, on average 90 lakh people travelled for work.
Figure 2: Reasons for intra-state migration

Sources: Census 2011; PRS.
Figure 3:Reasons for inter-state migration

Sources: Census 2011; PRS.
Issues faced by migrant labour
Article 19(1)(e) of the Constitution, guarantees all Indian citizens the right to reside and settle in any part of the territory of India, subject to reasonable restrictions in the interest of the general public or protection of any scheduled tribe. However, people migrating for work face key challenges including: i) lack of social security and health benefits and poor implementation of minimum safety standards law, ii) lack of portability of state-provided benefits especially food provided through the public distribution system (PDS) and iii) lack of access to affordable housing and basic amenities in urban areas. 2
Poor implementation of protections under the Inter-State Migrant Workmen Act, 1979 (ISMW Act)
The ISMW Act provides certain protections for inter-state migrant workers. Labour contractors recruiting migrants are required to: (i) be licensed, (ii) register migrant workers with the government authorities, and (iii) arrange for the worker to be issued a passbook recording their identity. Guidelines regarding wages and protections (including accommodation, free medical facilities, protective clothing) to be provided by the contractor are also outlined in the law.
In December 2011, a report by the Standing Committee on Labour observed that registration of workers under the ISMW Act was low and implementation of protections outlined in the Act was poor. The report concluded that the Central government had not made any concrete and fruitful efforts to ensure that contractors and employers mandatorily register the workers employed with them enabling access to benefits under the Act.
Lack of portability of benefits
Migrants registered to claim access to benefits at one location lose access upon migration to a different location. This is especially true of access to entitlements under the PDS. Ration card required to access benefits under the PDS is issued by state governments and is not portable across states. This system excludes inter-state migrants from the PDS unless they surrender their card from the home state and get a new one from the host state.
Lack of affordable housing and basic amenities in urban areas
The proportion of migrants in urban population is 47%.1 In 2015, the Ministry of Housing and Urban Affairs identified migrants in urban areas as the largest population needing housing in cities. There is inadequate supply of low-income ownership and rental housing options. This leads to the spread of informal settlements and slums. The Prime Minister Awaas Yojana (PMAY) is a central government scheme to help the economically weaker section and low-income group access housing. Assistance under the scheme includes: i) slum rehabilitation, ii) subsidised credit for home loans, iii) subsidies up to Rs 1.5 lakh to either construct a new house or enhance existing houses on their own and iv) increasing availability of affordable housing units in partnership with the private sector. Since housing is a state subject, there is variation in approach of States towards affordable housing.2
Steps taken by the government with regard to migrant labour during the lockdown
During the lockdown, several inter-state migrant workers tried to return to their home state. Due to the suspension public transport facilities, migrants started walking towards their home state on foot. Subsequently, buses and Shramik special trains were permitted by the central government subject to coordination between states.[3],[4] Between May 1 and June 3, more than 58 lakh migrants were transported through specially operated trains and 41 lakh were transported by road. Measures taken by the government to aid migrants include-
Transport: On March 28, the central government authorised states to use the State Disaster Response Fund to provide accommodation to traveling migrants. States were advised to set up relief camps along highways with medical facilities to ensure people stay in these camps while the lockdown is in place.
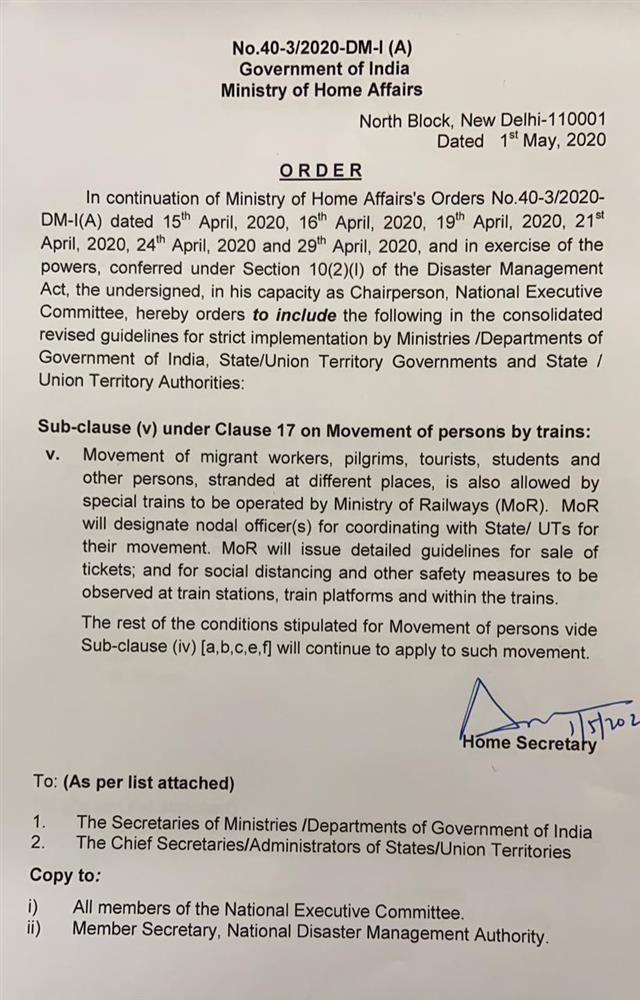
In an order issued on April 29, the Ministry of Home Affairs allowed states to co-ordinate individually to transport migrants using buses. On May 1, the Indian Railways resumed passenger movement (for the first time since March 22) with Shramik Special trains to facilitate movement of migrants stranded outside their home state. Between May 1 and June 3, Indian Railways operated 4,197 Shramik trains transporting more than 58 lakh migrants. Top states from where Shramik trains originated are Gujarat and Maharashtra and states where the trains terminated are Uttar Pradesh and Bihar.[5] Note that these trends largely correspond to the migration patterns seen in the 2011 census data.
Food distribution: On April 1, the Ministry of Health and Family Affairs directed state governments to operate relief camps for migrant workers with arrangements for food, sanitation and medical services. On May 14, under the second tranche of the Aatma Nirbhar Bharat Abhiyaan, the Finance Minister announced that free food grains would be provided to migrant workers who do not have a ration card for two months. The measure is expected to benefit eight crore migrant workers and their families. The Finance Minister also announced that One Nation One Ration card will be implemented by March 2021, to provide portable benefits under the PDS. This will allow access to ration from any Fair Price Shop in India.
Housing: The Aatma Nirbhar Bharat Abhiyaan also launched a scheme for Affordable Rental Housing Complexes for Migrant Workers and Urban Poor to provide affordable rental housing units under PMAY. The scheme proposes to use existing housing stock under the Jawaharlal Nehru National Urban Housing Mission (JnNURM) as well as incentivise public and private agencies to construct new affordable units for rent. Further, additional funds have been allocated for the credit linked subsidy scheme under PMAY for middle income group.
Financial aid: Some state governments (like Bihar, Rajasthan and Madhya Pradesh) announced one-time cash transfers for returning migrant workers. UP government announced the provision of maintenance allowance of Rs 1,000 for returning migrants who are required to quarantine.
Directions by the Supreme Court
The Supreme Court reviewed the situation of migrant labourers stranded in different parts of the country, noting inadequacies and lapses in government response to the situation.
[1] Census, 2011, Office of the Registrar General & Census Commissioner, Ministry of Home Affairs.
[2] Report of Working Group on Migration, Ministry of Housing and Urban Poverty Alleviation, January 2017, http://mohua.gov.in/upload/uploadfiles/files/1566.pdf.
[3] Order No. 40-3/2020-DM-I (A), Ministry of Home Affairs, April 29, 2020, https://prsindia.org/files/covid19/notifications/4233.IND_Movement_of_Persons_April_29.pdf.
[4] Order No. 40-3/2020-DM-I (A), Ministry of Home Affairs, May 1, 2020, https://prsindia.org/files/covid19/notifications/IND_Special_Trains_May_1.jpeg.
[5] “Indian Railways operationalizes 4197 “Shramik Special” trains till 3rd June, 2020 (0900hrs) across the country and transports more than 58 lacs passengers to their home states through “Shramik Special” trains since May 1”, Press Information Bureau, Ministry of Railways, June 3, 2020, https://pib.gov.in/PressReleseDetail.aspx?PRID=1629043.

