As of April 22, 2020, Sikkim does not have any confirmed cases of COVID-19. As of April 21, 2020, 87 samples have been sent for testing from Sikkim. Of these, 80 have tested negative for COVID-19, and the results of seven samples are awaited. The state has announced several policy decisions to prevent the spread of the virus and provide relief for those affected by it. In this blog post, we summarise some of the key measures taken by the Sikkim state government in this regard as of April 22, 2020.
Response before national lockdown
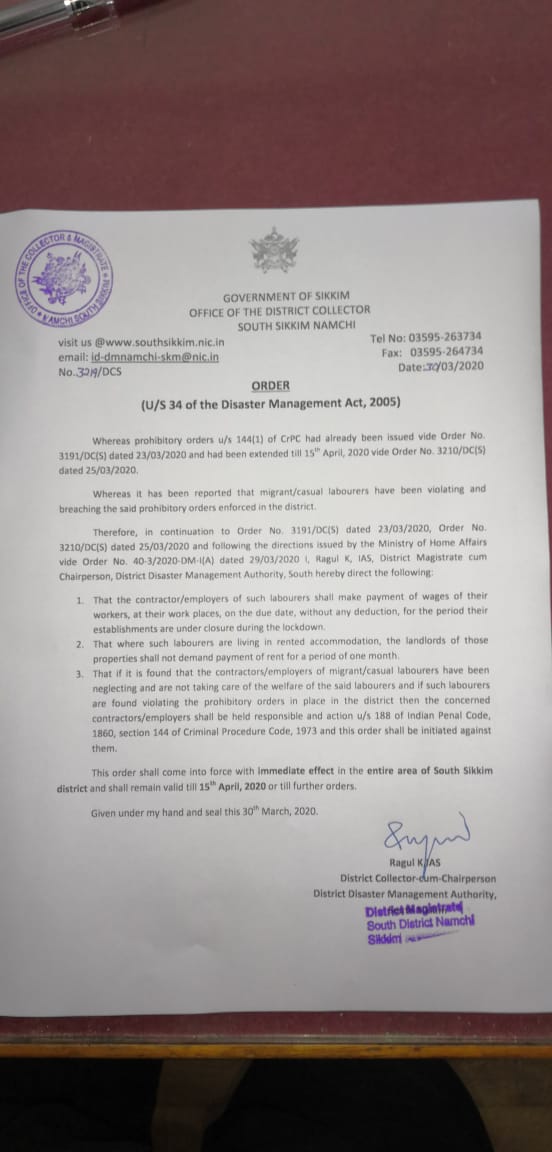
On March 16, the state government responded to the growing number of suspected cases in India by notifying certain directions to be applicable till April 15, 2020. These included: (i) banning the entry of all domestic and foreign tourists in to the state, (ii) closing all educational institutes and anganwadis, (iii) prohibiting the use of recreational facilities such as, casinos, gym, and cinemas, (iii) closing three out of five check posts (border opening) for all visitors in to the state and opening the other two only for medical and police teams, and (iv) banning private industries from getting migrant workers from outside the state and avoiding large concentration of workers at one place.
On March 19, assembly of more than five people was prohibited in the state until April 15, 2020. The government ordered the suspension of all non-essential work on March 19. The supply of all essential commodities such as food grains, vegetables, sanitisers and masks was allowed. Further, the formation of a sub-divisional task force to detect suspected cases was ordered.
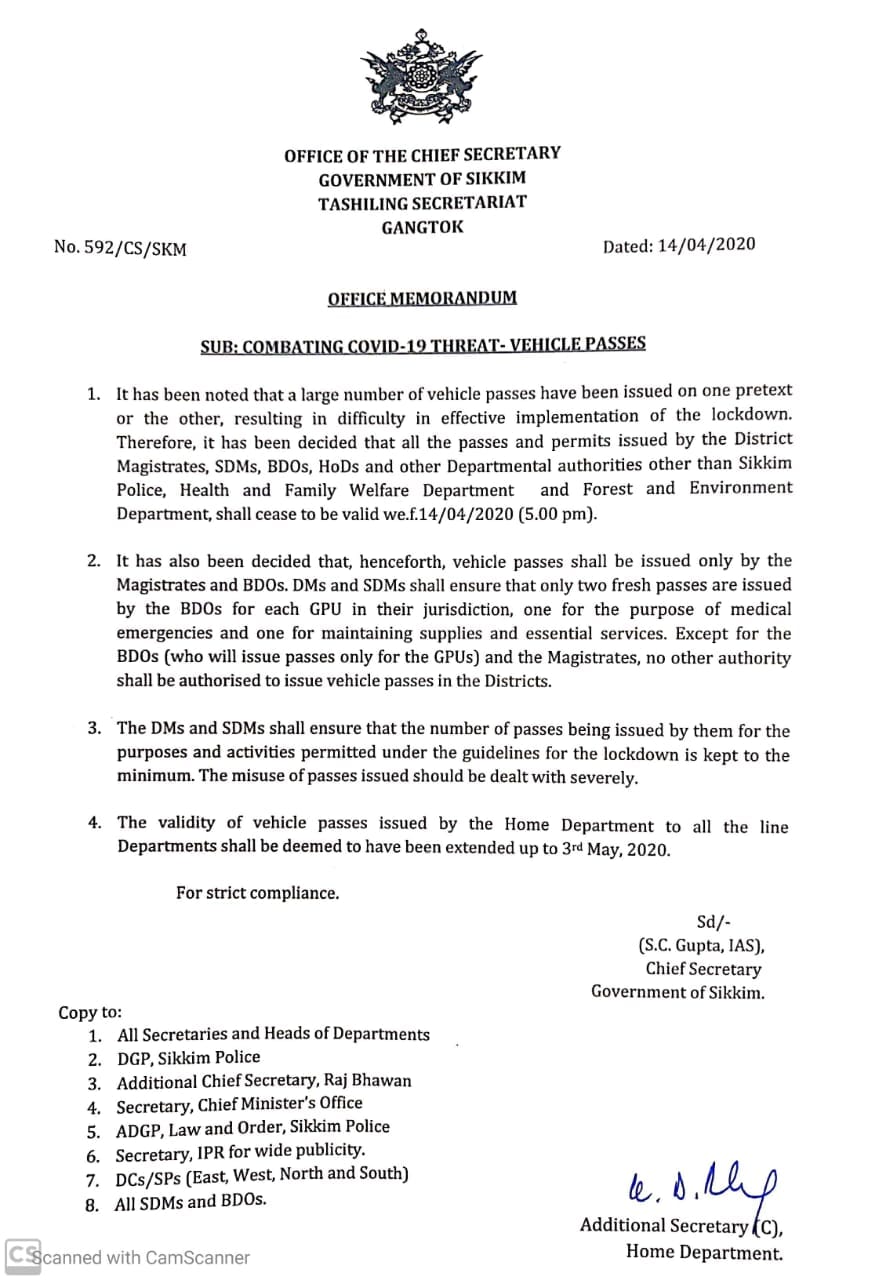
On March 22, the government regulated intra-state movement of private vehicles, two-wheelers and taxis on an odd-even basis (allowing plying of vehicles on alternate days as per the number plate) until April 15, 2020. The government also reduced the budget session of the state to two days on March 23.
On March 25, the central government announced on a 21-day country-wide lockdown till April 14. During the lockdown the state government took various steps for physical containment, health, financial and welfare measures. These are detailed below.
Measures taken during lockdown
Movement Restrictions
Certain movement restrictions were put across the state. These include:
Essential Goods and Services
On April 5, the state government issued an order requiring establishments such as shops, hotels, private offices, and commercial establishments to remain closed until April 15. Establishments which were permitted to remain functional include law enforcement agencies, health services, electricity and water services, petrol pumps, and media. Shops for PDS, groceries, vegetables, milk and, medicines were only allowed remain open from 9 am to 4 pm.
Health Measures
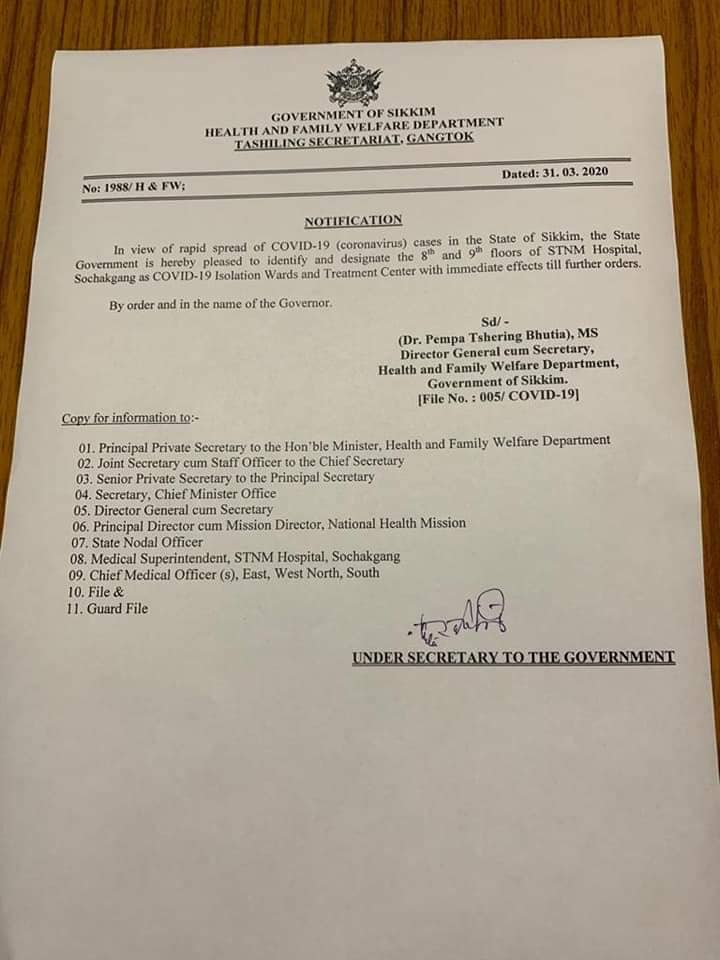
On March 31, the Sikkim government identified and set up dedicated isolation wards and treatment centres in the STNM hospital, Sochakgang as a precautionary measure. The government also issued directions for citizens to avoid getting infected by coronavirus. These included social distancing, and maintaining proper hygiene.
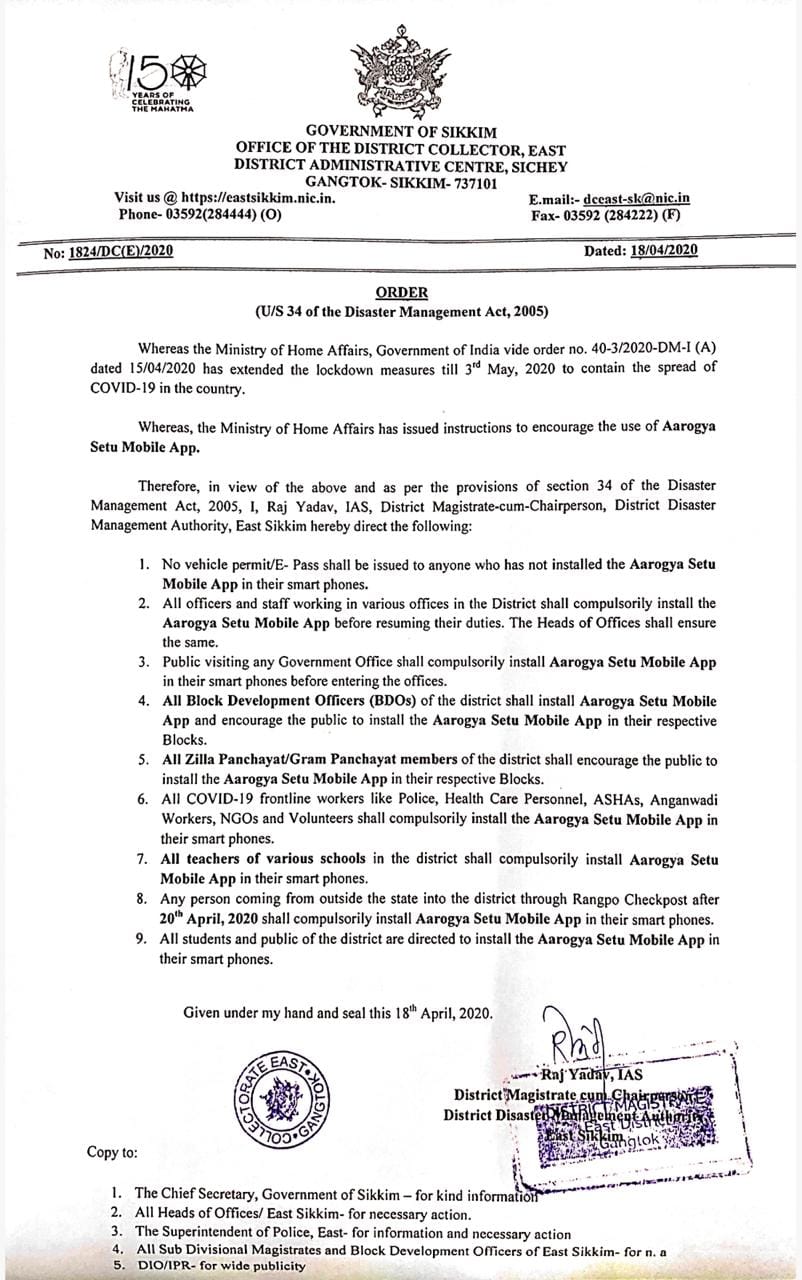
On April 18, the state government made it mandatory for all the public, students, teachers, and government employees, to install the Aarogya Setu application. The government of India launched a mobile app called ‘Aarogya Setu’ to enable people to assess the risk of catching COVID-19 on April 2, 2020. The app uses Bluetooth and Global Positioning System (GPS) based device location for contact tracing in order to prevent the spread of COVID-19.
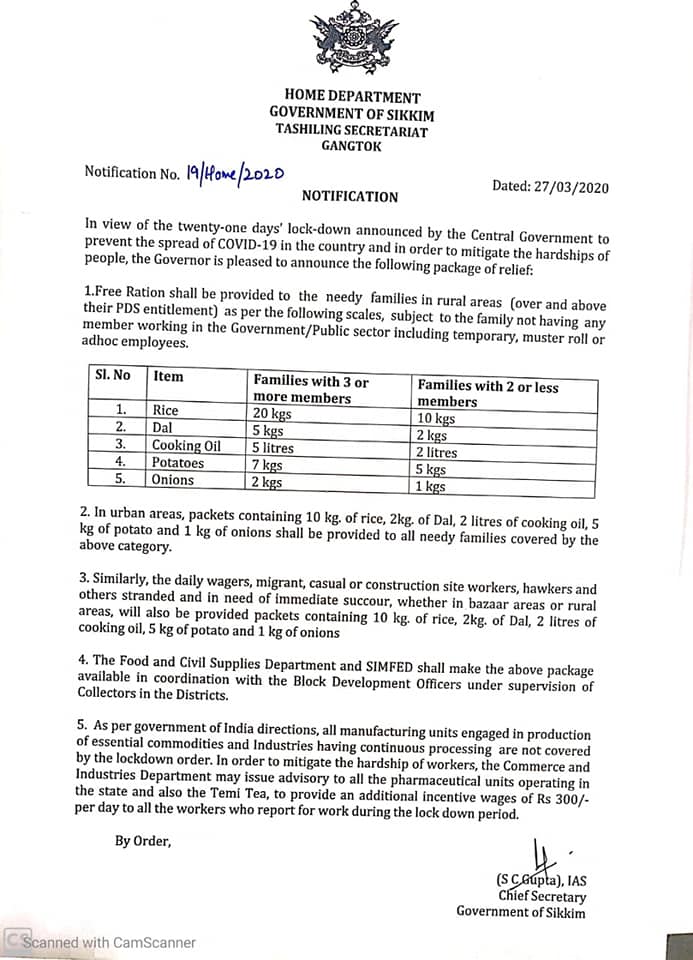
Welfare Measures
Certain relaxations after 20th April
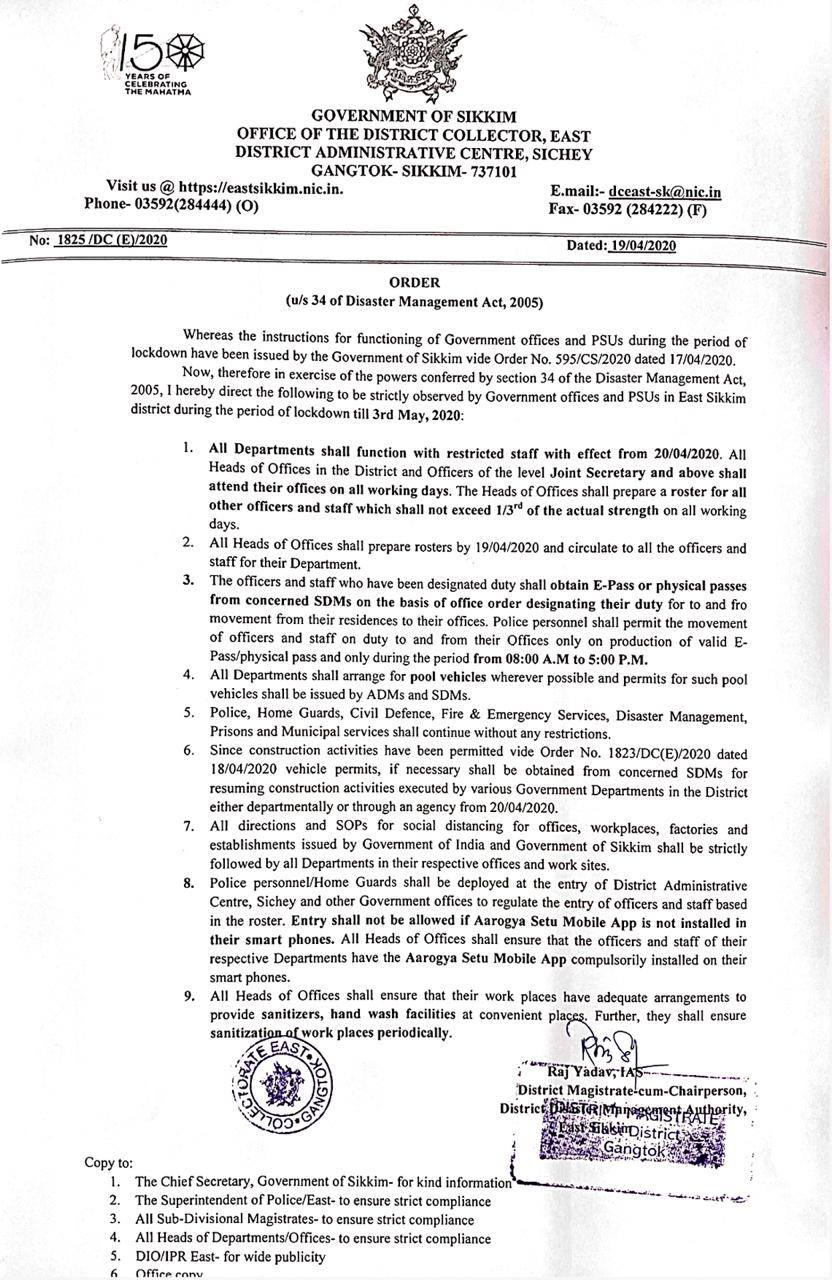
On April 14, the nation-wide lockdown was further extended till May 3, 2020. On April 15, the Ministry of Home Affairs issued guidelines outlining select activities which will be permitted from April 20 onwards. These activities include health services, agriculture related activities, certain financial sector activities, operation of Anganwadis, MNREGA works, and cargo movement. Further, subject to certain conditions, commercial and private establishments, industrial establishments, government offices, and construction activities will also be permitted. The Sikkim government took the following steps in the same line.
For more information on the spread of COVID-19 and the central and state government response to the pandemic, please see here.
The National Education Policy (NEP) 2020 was released on July 30, 2020. It will replace the National Policy on Education, 1986. Key recommendations of the NEP include: (i) redesigning the structure of school curriculum to incorporate early childhood care and education, (ii) curtailing dropouts for ensuring universal access to education, (iii) increasing gross enrolment in higher education to 50% by 2035, and (iv) improving research in higher education institutes by setting up a Research Foundation. In this blog, we examine the current status of education in the country in view of some of these recommendations made by the NEP.
Universal access to Education
The NEP states that the Right to Education Act, 2009 has been successful in achieving near universal enrolment in elementary education, however retaining children remains a challenge for the schooling system. As of 2015-16, Gross Enrolment Ratio was 56.2% at senior secondary level as compared to 99.2% at primary level. GER denotes enrolment as a percent of the population of corresponding age group. Further, it noted that the decline in GER is higher for certain socio-economically disadvantaged groups, based on: (i) gender identities (female, transgender persons), (ii) socio-cultural identities (scheduled castes, scheduled tribes), (iii) geographical identities (students from small villages and small towns), (iv) socio-economic identities (migrant communities and low income households), and (v) disabilities. In the table below, we detail the GER in school education across: (i) gender, and (ii) socio-cultural identities.
Table 1: GER in school education for different gender and social groups (2015-16)
|
Level |
Male |
Female |
SC |
ST |
All |
|
Primary (I-V) |
97.9% |
100.7% |
110.9% |
106.7% |
99.2% |
|
Upper Primary (VI-VIII) |
88.7% |
97.6% |
102.4% |
96.7% |
92.8% |
|
Secondary (IX-X) |
79.2% |
81% |
85.3% |
74.5% |
80% |
|
Senior Secondary (XI-XII) |
56% |
56.4% |
56.8% |
43.1% |
56.2% |
Sources: Educational Statistics at Glance 2018, MHRD; PRS.
Data for all groups indicates decline in GER as we move from primary to senior secondary for all groups. This decline is particularly high in case of Scheduled Tribes. Further, we analyse the reason for dropping out from school education. Data suggests that the most prominent reason for dropping out was: engagement in domestic activities (for girls) and engagement in economic activities (for boys).
Table 2: Major reasons for dropping out (Class 1-12) for 2015-16
|
Reason for dropping out |
Male |
Female |
|
Child not interested in studies |
23.8% |
15.6% |
|
Financial Constraints |
23.7% |
15.2% |
|
Engage in Domestic Activities |
4.8% |
29.7% |
|
Engage in Economic Activities |
31.0% |
4.9% |
|
School is far off |
0.5% |
3.4% |
|
Unable to cop-up with studies |
5.4% |
4.6% |
|
Completed desired level/ Class |
5.7% |
6.5% |
|
Marriage |
|
13.9% |
|
Other reasons |
5.1% |
6.2% |
Note: Other reasons include: (i) timings of educational Institution not suitable, (ii) language/medium of Instruction used unfamiliar, (iii) inadequate number of teachers, (iv) quality of teachers not satisfactory, (v) unfriendly atmosphere at school. For girl students, other reasons also include: (i) non-availability of female teachers, (ii) non-availability of girl’s toilet.
Sources: Educational Statistics at Glance 2018, MHRD; PRS.
The NEP recommends strengthening of existing schemes and policies which are targeted for such socio-economically disadvantaged groups (for instance, schemes for free bicycles for girls or scholarships) to tackle dropouts. Further, it recommends setting up special education zones in areas with significant proportion of such disadvantaged groups. A gender inclusion fund should also be setup to assist female and transgender students in getting access to education.
Increasing GER in Higher Education to 50% by 2035
The NEP aims to increase the GER in higher education to 50% by 2035. As of 2018-19, the GER in higher education in the country stood at 26.3%. Figure 2 shows the trend of GER in higher education over the last few years. Note that the annual growth rate of GER in higher education in the last few years has been around 2%.
Figure 1: GER in Higher Education (2014-15 to 2018-19)

Sources: All India Survey on Higher Education, MHRD; PRS.
Table 3: Comparison of GER (higher education) with other countries
|
Country |
GER (2017-18) |
|
India |
25% |
|
Brazil |
51% |
|
China |
49% |
|
Indonesia |
36% |
|
South Africa |
22% |
|
Pakistan |
9% |
|
Germany |
70% |
|
France |
66% |
|
United Kingdom |
60% |
Sources: UNESCO; PRS.
The NEP recommends that for increasing GER, capacity of existing higher education institutes will have to be improved by restructuring and expanding existing institutes. It recommends that all institutes should aim to be large multidisciplinary institutes (with enrolments in thousands), and there should be one such institution in or near every district by 2030. Further, institutions should have the option to run open distance learning and online programmes to improve access to higher education.
Foundational literacy and numeracy
The NEP states that a large proportion of the students currently enrolled in elementary school have not attained foundational literacy and numeracy (the ability to read and understand basic text, and carry out basic addition and subtraction). It recommends that every child should attain foundational literacy and numeracy by grade three.
Table 4 highlights the results of the National Achievement Survey 2017 on the learning levels of students at Grade 3 in language and mathematics. The results of the survey suggest that only 57% students in Grade 3 are able to solve basic numeracy skills related to addition and subtraction.
Table 4: NAS results on learning level of Grade-3 students
|
Learning level (Grade 3) |
Percentage of students |
|
Ability to read small texts with comprehension (Language) |
68% |
|
Ability to read printed scripts on classroom walls such as poems, posters (Language) |
65% |
|
Solving simple daily life addition and subtraction problems with 3 digits (Mathematics) |
57% |
|
Analyses and applies the appropriate number operation in a situation (Mathematics) |
59% |
Sources: National Achievement Survey (2017) dashboard, NCERT; PRS.
To achieve universal foundational literacy and numeracy, the Policy recommends setting up a National Mission on Foundational Literacy and Numeracy under the MHRD. All state governments must prepare implementation plans to achieve these goals by 2025. A national repository of high-quality resources on foundational literacy and numeracy will be made available on government’s e-learning platform (DIKSHA). Other measures to be taken in this regard include: (i) filling teacher vacancies at the earliest, (ii) ensuring a pupil to teacher ratio of 30:1 for effective teaching, and (iii) training teachers to impart foundational literacy and numeracy.
Effective governance of schools
The Policy states that establishing primary schools in every habitation across the country has helped increase access to education. However, it has led to the development of schools with low number of students. The small size of schools makes it operationally and economically challenging to deploy teachers and critical physical resources (such as library books, sports equipment).
With respect to this observation, the distribution of schools by enrolment size can be seen in the table below. Note that, as of September 2016, more than 55% of primary schools in the country had an enrolment below 60 students.
Table 5: Distribution of schools by enrolment size
|
Strength (Grade) |
Below 30 |
31-60 |
61-90 |
91-120 |
121-150 |
151-200 |
More than 200 |
|
Primary schools (Class 1-5) |
28.0% |
27.5% |
16.0% |
10.3% |
6.3% |
5.6% |
6.4% |
|
Upper primary schools (Class 6-8) |
14.8% |
27.9% |
18.7% |
15.0% |
8.4% |
7.2% |
8.0% |
|
Upper primary schools (Class 1-8) |
5.7% |
11.6% |
13.0% |
12.1% |
10.4% |
13.4% |
33.8% |
Sources: Flash Statistics on School Education 2016-17, UDISE; PRS.
While nearly 80% primary schools had a library, only 1.5% schools had a librarian (as of September 2016). The availability of facilities is better in higher senior secondary schools as compared to primary or upper primary schools.
Table 6: Distribution of schools with access to physical facilities
|
Facilities |
Primary schools (Class 1-5) |
Upper primary schools (Class 1-8) |
Higher senior secondary |
|
Library |
79.8% |
88.0% |
94.4% |
|
Librarian |
1.5% |
4.5% |
34.4% |
|
Playground |
54.9% |
65.5% |
84.3% |
|
Functional computer |
4.4% |
25.2% |
46.0% |
|
Internet connection |
0.9% |
4.2% |
67.9% |
Sources: Flash Statistics on School Education 2016-17, UDISE; PRS.
To overcome the challenges associated with development of small schools, the NEP recommends grouping schools together to form a school complex. The school complex will consist of one secondary school and other schools, aanganwadis in a 5-10 km radius. This will ensure: (i) adequate number of teachers for all subjects in a school complex, (ii) adequate infrastructural resources, and (iii) effective governance of schools.
Restructuring of Higher Education Institutes
The NEP notes that the higher education ecosystem in the country is severely fragmented. The present complex nomenclature of higher education institutes (HEIs) in the country such as ‘deemed to be university’, ‘affiliating university’, ‘affiliating technical university', ‘unitary university’ shall be replaced simply by 'university'.
According to the All India Survey on Higher Education 2018-19, India has 993 universities, 39,931 colleges, and 10,725 stand-alone institutions (technical institutes such as polytechnics or teacher training institutes).
Table 7: Number of Universities in India according to different categories
|
Type of university |
Number of universities |
|
Central University |
46 |
|
Central Open University |
1 |
|
Institutes of National Importance |
127 |
|
State Public University |
371 |
|
Institution Under State Legislature Act |
5 |
|
State Open University |
14 |
|
State Private University |
304 |
|
State Private Open University |
1 |
|
Deemed University- Government |
34 |
|
Deemed University- Government Aided |
10 |
|
Deemed University- Private |
80 |
|
Total |
993 |
Sources: All India Survey on Higher Education 2018-19; PRS.
The NEP recommends that all HEIs should be restructured into three categories: (i) research universities focusing equally on research and teaching, (ii) teaching universities focusing primarily on teaching, and (iii) degree granting colleges primarily focused on undergraduate teaching. All such institutions will gradually move towards full autonomy - academic, administrative, and financial.
Setting up a National Research Foundation to boost research
The NEP states that investment on research and innovation in India, at only 0.69% of GDP, lags behind several other countries. India’s expenditure on research and development (R&D) in the last few years can be seen in the figure below. Note that the total investment on R&D in India as a proportion of GDP has been stagnant at around 0.7% of GDP. In 2018-19, the total expenditure on R&D in India was Rs 1,23,848 crore. Of this, Rs 72,732 crore (58%) of expenditure was by government, and the remaining (42%) was by private industry.
Figure 2: R&D Expenditure in India (2011-12 to 2018-19)

Sources: S&T Indicators Table 2019-20, Ministry of Science and Technology, March 2020; PRS.
Figure 3: Comparison of R&D expenditure in India with other countries (2017)

Sources: S&T Indicators Table 2019-20, Ministry of Science and Technology, March 2020; PRS.
To boost research, the NEP recommends setting up an independent National Research Foundation (NRF) for funding and facilitating quality research in India. The Foundation will act as a liaison between researchers and relevant branches of government as well as industry. Specialised institutions which currently fund research, such as the Department of Science and Technology, and the Indian Council of Medical Research, will continue to fund independent projects. The Foundation will collaborate with such agencies to avoid duplication.
Digital education
The NEP states that alternative modes of quality education should be developed when in-person education is not possible, as observed during the recent pandemic. Several interventions must be taken to ensure inclusive digital education such as: (i) developing two-way audio and video interfaces for holding online classes, and (ii) use of other channels such as television, radio, mass media in multiple languages to ensure reach of digital content where digital infrastructure is lacking.
In this context, we analyse: (i) the availability of computer and internet across households in India, and (ii) ability to use computer or internet by persons in the age group of 5-14. As of 2017-18, the access to internet and computer was relatively poor in rural areas. Only 4.4% of rural households have access to a computer (excludes smartphones), and nearly 15% have access to internet facility. Amongst urban households, 42% have access to internet.
Table 8: Access to Computer and Internet across households (2017-18)
|
Access to ICT |
Rural |
Urban |
Overall |
|
Households having computer |
4.4% |
23.4% |
10.7% |
|
Households having internet facility |
14.9% |
42.0% |
23.8% |
Note: Computer includes desktop, laptop, notebook, tablet. It does not include smartphone.
Sources: Household Social Consumption on Education (2017-18), Ministry of Statistics and Programme Implementation, July 2020; PRS.
Table 9: Ability to use Computer and Internet across persons in the age group 5-14 (2017-18)
|
Ability to use ICT |
Rural |
Urban |
Overall |
|
Ability to use computer |
5.1% |
21.3% |
9.1% |
|
Ability to use internet |
5.1% |
19.7% |
8.8% |
Note: Ability to use computer means to be able to carry out any of the tasks such as: (i) copying or moving a file/folder, (ii) sending emails, (iii) transferring files between a computer and other devices, among others. Ability to use internet means to be able to use the internet browser for website navigation, using e-mail or social networking applications.
Sources: Household Social Consumption on Education (2017-18), Ministry of Statistics and Programme Implementation, July 2020; PRS.
Public spending on education to be increased to 6% of GDP
The recommendation of increasing public spending on Education to 6% of GDP was first made by the National Policy on Education 1968 and reiterated by the 1986 Policy. NEP 2020 reaffirms the recommendation of increasing public spending on education to 6% of GDP. In 2017-18, the public spending on education (includes spending by centre and states) was budgeted at 4.43% of GDP.
Table 10: Public spending on Education (2013-2018)
|
Year |
Public expenditure (Rs crore) |
% of GDP |
|
2013-14 |
4,30,879 |
3.84% |
|
2014-15 |
5,06,849 |
4.07% |
|
2015-16 |
5,77,793 |
4.20% |
|
2016-17 |
6,64,265 |
4.32% |
|
2017-18 |
7,56,945 |
4.43% |
Sources: 312th Report, Standing Committee on Human Resource Development, March 2020; PRS.
Figure 4: Comparison of public spending on Education in India with other countries as % of GDP (2015)

Sources: Educational Statistics at Glance 2018, MHRD; PRS.
In the figure below, we look at the disparities within states in education spending. In 2020-21, states in India have allocated 15.7% of their budgeted expenditure towards education. States such as Delhi, Rajasthan, and Maharashtra have allocated more than 18% of their expenditure on Education for the year 2020-21. On the other hand, Telangana (7.4%), Andhra Pradesh (12.1%) and Punjab (12.3%) lack in spending on education, as compared to the average of states.
Figure 5: Budgeted allocation on Education (2020-21) by states in India

Note: AP is Andhra Pradesh, UP is Uttar Pradesh, HP is Himachal Pradesh and WB is West Bengal.
Sources: Analysis of various state budget documents; PRS.
For a detailed summary of the National Education Policy, see here.

