

In India, the Union and the states have a shared responsibility of managing water resources in the country. States can make laws on water supply, irrigation, water storage, and water power.[1] Parliament can make laws on the regulation of inter-state rivers and river valleys. The Union Ministry of Jal Shakti plays a nodal role in coordinating the development of the country’s water resources.[2] It is also responsible for ensuring clean drinking water and sanitation facilities to all citizens.[3] The Ministry has two departments, the Department of Drinking Water and Sanitation, and the Department of Water Resources, River Development, and Ganga Rejuvenation. The Ministry was formed in 2019 by merging the two erstwhile ministries.[4]
This note analyses the expenditure by the Ministry of Jal Shakti and related schemes. It also discusses key issues in water resource management.
Overview of Finances
The Ministry of Jal Shakti has been allocated Rs 98,714 crore in 2024-25, an increase of 2% over the revised estimate for 2023-24.[5],[6] 78% of this allocation is towards Department of Drinking Water and Sanitation (Rs 77,391 crore).
Table 1: Budget allocation to the Ministry of Jal Shakti (in Rs crore)
|
Department |
2022-23 Actuals |
2023-24 BE |
2023-24 RE |
2024-25 BE |
% Change from 23-24 RE to 24-25 BE |
|
Drinking Water and Sanitation |
59,665 |
77,223 |
77,033 |
77,391 |
0.5% |
|
Of which, |
|||||
|
JJM |
54,700 |
70,000 |
70,000 |
70,163 |
0.2% |
|
SBM-G |
4,925 |
7,192 |
7,000 |
7,192 |
3% |
|
Water Resources |
11,962 |
20,055 |
19,517 |
21,323 |
9% |
|
Of which, |
|||||
|
PMKSY |
5,637 |
8,587 |
7,031 |
9,339 |
33% |
|
River Interlinking |
624 |
3,500 |
1,400 |
3,500 |
150% |
|
Namami Gange |
2,048 |
4,000 |
2,400 |
3,346 |
39% |
|
ABY |
1,155 |
1,000 |
1,778 |
1,778 |
0% |
|
Other schemes |
457 |
500 |
254 |
497 |
95% |
|
Total |
71,628 |
97,278 |
96,550 |
98,714 |
2% |
Note: BE is budget estimate and RE is revised estimate. Other schemes include allocation towards the Dam Rehabilitation and Improvement Programme and Flood Management and Border Areas Programme.
Sources: Demands for Grants 2024-25, Ministry of Jal Shakti; PRS.
In 2024-25, allocation towards Department of Drinking Water and Sanitation is about same as the revised estimates for 2023-24 (0.5% increase). In comparison, allocation for Department of Water Resources has increased by 9% over the revised estimates for 2023-24.
|
Policy proposals in Union Budget 2024-25
|
Department of Drinking Water and Sanitation
The Department of Drinking Water and Sanitation implements two key centrally sponsored schemes: (i) Jal Jeevan Mission (JJM), to provide piped water supply in rural areas, and (ii) Swachh Bharat Mission - Grameen (SBM-G) to provide for sanitation in rural areas.3 In 2024-25, 91% of the total allocation for the Department is towards JJM (Rs 70,163 crore), and 9% is towards SBM-G (Rs 7,192 crore). The allocation for SBM-G has increased by 3%, while the allocation for JJM has remained almost the same as the revised estimates for 2023-24.
Jal Jeevan Mission
Launched in 2019, JJM (formerly the National Rural Drinking Water Scheme) aims to provide functional tap water connections to all rural households by 2024 (19.3 crore households).[7] It also promotes water recharge and reuse techniques through grey water management and water conservation.7 Grey water includes wastewater generated due to domestic purposes other than toilets. In 2024-25, Rs 70,163 crore has been allocated to JJM. In 2022-23, 91% of funds allocated to JJM were utilised.[8]
Availability of tapped water
Wide variation in achievements by states: The achievement of targets and indicators under JJM varies across states. According to the JJM Dashboard, as on July 28, 2024, 78% of Indian households have a functional household tap water connection (FHTC).[9] However, the proportion of households with a functional tap water connection is less than 60% in Jharkhand, Kerala, Rajasthan, and West Bengal. All households have a functional tap connection in eight states and three Union Territories.9
As of July 2024, none of the villages in Telangana and only one in Bihar have been certified under the Har Ghar Jal status.9 A village is considered to be Har Ghar Jal certified after it is verified that all households, schools, and Anganwadi Centres have tap water supply. All villages have been certified in Arunachal Pradesh, Goa, Haryana, and Punjab.9 In ten other states and Union Territories, less than 50% of villages have been certified (see Annexure I).
Figure 1: Wide variation in % of households with functional tap water connections across states (as of July 2024)

Source: JJM Dashboard, accessed on July 28, 2024; PRS.
Irregularity of water supply: The National Report of Functionality Assessment 2022 (conducted by the Ministry) noted that about 74% of households receive water all seven days a week.[10] 8% of households receive water only once a week. The average duration of water supply was three hours per day.10 80% households reported that their daily water requirements are being met by the household tap water connections.
The report also found state-wise variations in the supply of water to households with tap water connections.10 A connection is defined as functional if it supplies 55 litre per capita quantity of water per day, the supplied water is potable, and water is available regularly (i.e. for all 12 months in a year, or daily as per schedule). In six states including Goa, Meghalaya, Telangana, and West Bengal, 90% or more households received water regularly.10 However, in Madhya Pradesh, Manipur, Odisha, Rajasthan, and Uttar Pradesh, less than 70% of households had regular water supply (see Annexure I).
Water Quality
Water for taps under JJM comes from surface water sources or safe ground water resources in villages with water quality issues.[11] One of the priorities of JJM is to ensure that houses get potable drinking water. As on April 2019, 57,539 habitations over 11 states reported quality issues in drinking water sources.[12] This figure reduced to 19,085 habitations as of June 2023.[13] Habitations under JJM are a group of minimum 20 households or 100 persons.[14]
Community water purification plants have been installed in all habitations impacted by fluoride and arsenic contamination, and 67% habitations where water is contaminated with heavy metals.13 However, this covers only 6% of habitations which reported water quality issues. The Standing Committee (2023-24) recommended that the Department emphasise to states the necessity of taking measures that could provide an immediate solution.11 These could include installing small water purification dispensers or providing mobile water vans/tankers carrying safe and clean drinking water. Permanent measures to provide quality drinking water under JJM should also be taken.11
Table 2 : Affected Habitations under JJM (as of June 2023)
|
Major Contaminants |
Quality affected habitations |
Covered with short term measures/CWPP |
% covered |
|
Fluoride |
420 |
420 |
100% |
|
Arsenic |
582 |
582 |
100% |
|
Iron |
8,593 |
4 |
0.05% |
|
Salinity |
8,929 |
9 |
0.1% |
|
Nitrate |
475 |
9 |
2% |
|
Heavy Metal |
86 |
58 |
67% |
Source: Report No. 28, Standing Committee on Water Resources, February 6, 2024, Lok Sabha; PRS.
Two of the key challenges in the implementation of JJM highlighted by the Ministry are the lack of dependable drinking water sources in water- stressed areas, and the presence of geo-genic contaminants in ground water.[15] Other challenges include uneven terrain and scattered rural habitations. The Ministry has also highlighted that local village communities lack the capacity to operate and manage water supply infrastructure.15
Swachh Bharat Mission-Grameen
The Swachh Bharat Mission- Grameen (SBM-G) was launched in 2014, and sought to achieve universal sanitation coverage, eliminate open defecation, and improve cleanliness in rural areas by 2019.[16] By October 2019, all villages under the scheme declared themselves Open Defecation Free (ODF).[17] The total allocation for Phase II of this scheme (2020-21 to 2024-25), which focuses on solid and liquid waste management, is Rs 1.4 lakh crore.[18] In 2024-25, Rs 7,192 crore has been allocated to SBM-G. The same amount was allocated to the scheme in budget 2023-24.
SBM-G Phase I: While all villages were declared as ODF in October 2019, according to the National Family Health Survey 5 (2019-21), 19% of all households practiced open defecation (26% rural and 6% urban).[19]
Phase I also focused on safe technology for sanitation such as twin-pit technology. Retrofitting toilets from single pit to twin pit allows for better sludge management.13 The Standing Committee on Water Resources (2023-24) noted that in 14 states and Union Territories including Goa, Meghalaya, Nagaland, and Rajasthan, the majority of single pit toilets were not retrofitted.13 The Committee recommended using funds from the MGNREGS and 15th Finance Commission grants for retrofitting.
SBM-G Phase II: This phase aims to sustain the ODF status, and certify villages as ODF Plus.18,[20] If the village is visually clean, sustains its ODF status, and has arrangements for solid and liquid waste management, it is certified as ODF Plus. As of July 2024, 93% of 5.9 lakh SBM villages have been declared ODF plus.[21] 3.5 lakh villages have solid waste management facilities and 4.9 lakh have liquid waste management facilities.21
One of the objectives under Phase II is to ensure plastic waste management in villages.13 Gram Panchayats are required to arrange door to door plastic waste collection, segregation, and recycling. Plastic that cannot be recycled has to be sent to block level Plastic Waste Management Units (PWMUs). Each block has been allocated Rs 16 lakh to set up a PWMU.13 As of February 2024, PWMUs have been set up in only 13% blocks.13
Release of Funds
SBM(G) is a Centrally Sponsored Scheme with fund sharing pattern between Centre and states as follows: (i) 90:10 for north-eastern states, Himachal Pradesh, Uttarakhand and UT of Jammu and Kashmir, (ii) 100% for remaining Union Territories (UTs), and (iii) 60:40 for other states.[22] States/UTs also have the flexibility to provide additional funding from other sources such as 15th Finance Commission grants, MPLAD, MLALAD or CSR funds, or through convergence with other central or state schemes such as MGNREGS.22 Funds will be released to states/UTs based on their performance and ability to achieve programme results.22 Funds under SBM(G) will be released to the state/UTs only after the respective government provides the undertaking that funds earmarked under 15th Finance Commission grants for sanitation activities are being devolved to rural local bodies. Non-compliance with conditions set under the Scheme will affect future release of grants from the Centre.22
Between 2020-21 and 2023-24, 36% of funds allocated to states and Union Territories under SBM-G has been released.[23] In 2022-23, no funds were released to four states including Haryana, Maharashtra, and Telangana.23 As of February 2024, no funds allocated for 2023-24 have been released to seven states, including Andhra Pradesh, Maharashtra, and Kerala.
Figure 2 : 36% of allocated funds have been released to states under SBM-G
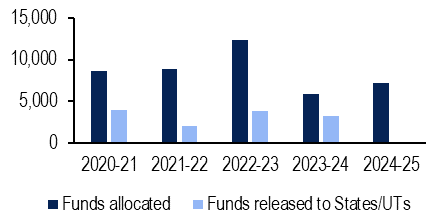
Source: Unstarred Question No. 1124, Ministry of Jal Shakti, Lok Sabha, February 8, 2024; PRS.
Delays in releasing state share: In 2022-23, 10 states, including Bihar, Kerala, West Bengal and Uttar Pradesh, delayed releasing funds for SBM-G.13 States provided various reasons for delays, including law and order situation (Manipur), procedural delays (West Bengal), and resource constraints or re-appropriation of funds (Kerala and Nagaland). In February 2023, the Ministry of Finance decided to charge interest if states delayed releasing their share of funds for Centrally Sponsored Schemes, like SBM-G.[24] The Standing Committee (2023-24) noted that charging interest on delayed payments could create a deterrent effect on states.13 However, states with genuine resource constraints would find their situation worsened if required to pay interest. The Committee recommended that the Department devise incentives to states which would enable timely release and utilisation of funds.13
Department of Water Resources, River Development and Ganga Rejuvenation
The Department of Water Resources, River development and Ganga Rejuvenations focuses on water resource management, flood and irrigation management, groundwater development and rejuvenation of rivers in the country.[25] In 2024-25, Rs 21,323 crore has been allocated to the Department, a 9% increase over the revised estimates of 2023-24.5 This increase is primarily due to increased allocation towards Pradhan Mantri Krishi Sinchai Yojana, river interlinking, and the Namami Gange programme.
Pradhan Mantri Krishi Sinchai Yojana (PMKSY)
PMKSY was launched in 2015-16 with the aims of: (i) improving physical access of water on farms and water use efficiency, (ii) expanding cultivable area under assured irrigation, and (iii) introducing sustainable water conservation.[26] The Ministry of Jal Shakti implements two major components of the scheme, the Accelerated Irrigation Benefit Programme (AIBP), and Har Khet Ko Pani (HKKP). Through AIBP, states are provided financial assistance to implement major/medium irrigation projects delayed due to financial constraints.[27] HKKP targets to create 3.7 lakh hectares of irrigation potential through surface minor irrigation, and repair, renovation and restoration of water bodies.26
Between 2016 and 2023, Rs 49,751 crore of central assistance has been released under PMKSY.[28] 55% of projects have been completed as of December 2023.[29]
Table 3 : About half of the projects taken up under PMKSY have been completed (as of December 2023)
|
Component |
Total Projects |
Completed Projects |
% Completion |
|
AIBP |
115 |
54 |
47% |
|
SMI |
7,359 |
4,012 |
55% |
|
RRR |
3,270 |
1,869 |
57% |
|
Watershed Development |
13 |
12 |
92% |
|
Total |
10,757 |
5,947 |
55% |
Note: SMI is Surface Minor Irrigation, RRR is Repair, Renovation and Restoration of Water Bodies.
Source: Starred Question No. 162, Ministry of Jal Shakti, Rajya Sabha, December 18, 2023; PRS.
Atal Bhujal Yojana
Atal Bhujal Yojana (ABY) was launched in 2020 and is being implemented in seven water stressed states (Gujarat, Haryana, Karnataka, Madhya Pradesh, Maharashtra, Rajasthan and Uttar Pradesh).[30] The aim of the scheme is to enhance sustainable groundwater management through community led techniques.
ABY has been allocated Rs 6,000 crore for a period of five years.[31] Of this, Rs 1,400 crore has been allocated towards Institutional Strengthening and Capacity Building. Rs 4,600 crore has been allocated for providing incentives for preparation of Water Security Plans (WSP), improving the rate of decline of ground water level, and adopting practices for efficient water use.31 As of July 2024, 56% of allocated funds have been released, and 72% of released funds have been spent.31
Figure 3 : Cumulative allocation and actual expenditure under Atal Bhujal Yojana (in Rs crore)
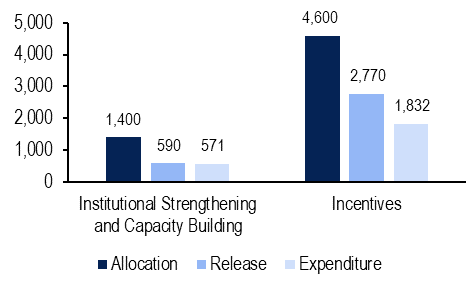
Source: ABY Dashboard as accessed on July 25, 2024; PRS.
Achievement of targets
A review of the scheme by the World Bank, conducted in 2023, concluded that the program will achieve its objectives by March 31, 2025.[32] The status of achievement of targets under ABY as of July 2024, is given in Table 4.31 4.5 lakh hectares of area was targeted to be brought under efficient water use practices by 2025.31 As of July 2024, 64% of this target has been achieved.
Table 4 : Some targets under ABY have been met, but achievement is low in others
|
Components |
Target |
Achievement |
% Achieved |
|
Number of Gram Panchayat training |
2,10,576 |
81,836 |
39% |
|
Equipment installed |
82,935 |
50,998 |
61% |
|
Number of GPs where Water Security Plans have been prepared |
8,220 |
8,220 |
100% |
|
Area where efficient water use practices have been adopted (in ha) |
4,50,000 |
2,86,010 |
64% |
|
Number of blocks with improvement in the rate of decline of groundwater levels |
229 |
47 |
21% |
Source: ABY Dashboard, accessed on July 25, 2024; PRS.
Under the scheme, the rate of decline of ground water level was targeted to be reduced in 229 blocks. This has been achieved in 47 blocks.31
Extending the coverage of ABY
The Standing Committee on Water Resources (2023) observed that the seven states where ABY is being implemented only account for 37% of the water-stressed blocks in India.32 However, states with acute ground water shortage such as Punjab, Himachal Pradesh, Delhi and Tamil Nadu have not been covered under the scheme.[33] The Committee recommended that the scheme should be extended to all states with scarce ground water. The Committee also noted that some water-stressed blocks are not being covered under the scheme in the states where ABY is being implemented.32 It recommended including these blocks under the scheme.
Namami Gange Programme
Launched in 2014, the Namami Gange Programme aims to rejuvenate the river Ganga and its tributaries. The programme focuses on abatement of pollution in the river and its conservation.[34] The main pillars of the program include: (i) sewerage treatment infrastructure, (ii) river-surface cleaning, (iii) river-front development, and (iv) industrial effluent monitoring. The National Mission for Clean Ganga (NMCG) is tasked with implementation of the programme.
As of June 2024, 467 projects worth Rs 43,159 crore have been sanctioned under the programme.[35] Rs 19,052 crore (44% of sanctioned amount) has been released, and Rs 18,739 crore has been spent (43% of sanctioned amount). 292 projects have been completed (63% of sanctioned).35
Unspent funds
Funds allocated towards Namami Gange have been underutilised in every year since 2014-15, except in 2021-22. 5,[36] Cumulatively, only 51% of the budgeted amount has been spent on this programme.
Figure 4 : Namami Gange funds have been consistently under-utilised since 2014-15
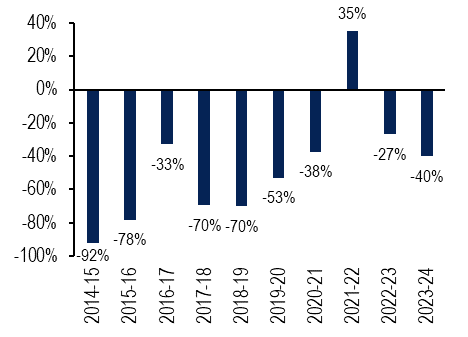
Source: Demands of Grants of various years; CAG; PRS.
The Clean Ganga Fund (CGF) was formed to finance Ganga rejuvenation activities through contributions from the public, non-resident Indians, persons of Indian origin, and others.[37] As of August 2022, the CGF has Rs 616 crore.37 Projects worth Rs 399 crore have been sanctioned using these funds. Of this, Rs 161 crore has been spent, as of August 2022.37
Improper programme management
In 2024, the Public Accounts Committee (PAC) highlighted several issues in the management and implementation of the Namami Gange programme.37 The Committee found that the NMCG had not finalised long-term action plans. As per the National Ganga River Basin Authority framework, Detailed Project Reports submitted by states must be reviewed within 60 days. However, in an audit of detailed project reports, it was found that some were pending with the NMCG for 120 to 780 days.37 The Committee also observed lapses in record keeping by the NMCG.37
Delays in the implementation of projects under Namami Gange have been highlighted by courts and tribunals.37,[38] The PAC recommended that the Ministry of Jal Shakti and the NMCG provide a detailed and transparent timeline of all projects.37 It also recommended that these bodies review their project management processes and take measures to ensure that projects are completed on time.
Sewage Treatment Capacity around Ganga
Extensive urbanisation and industrialisation has threatened the quality of Ganga river water.36 In the Ganga basin, 12,000 million litres of sewage is generated every day.[39] The NMCG targets to sanction a sewage treatment capacity of 7,000 million litres a day by December 2026.[40] As of June 2024, while 86% of the targeted sewage network (5,282 kms) has been laid, only 52% of the targeted sewage treatment capacity (6,217 million litres a day) has been achieved.35
Issues for Consideration
Water Availability and Quality
Per capita water availability provides a good estimate for the extent of water stress in the country. The average annual per capita water availability in India has decreased to 1,545 cubic metres (based on 2011 census) from 1,816 cubic metres (in 2001).[41] The Central Water Commission estimates this to reduce further to 1,434 cubic meters in 2025, and 1,219 cubic meters in 2050.[42] Annual per capita water availability below 1,700 cubic metres indicates a water-stressed condition, while a figure below 1,000 cubic metres indicates water scarcity.41 India is currently in a water-stressed condition. Due to the large geographical and climatic variability in India, some regions may be more water-stressed than others.41 The 15th Finance Commission noted that 600 million Indians were facing high to extreme water stress in 2020.[43]
India primarily receives water from rivers, ground water, and precipitation.42 The utilisable water resources of the country are 1,126 billion cubic meters (BCM) per year (2021), of which 61% is from surface water, and 39% from ground water.42 About 40% of utilisable surface water comes from the Ganga-Brahmaputra-Meghna river basin.42
It is estimated that 85-90% of water use in the country is for agriculture.[44] In 2019-20, 54% of the net sown area in the country was irrigated.[45] However, water use efficiency in Indian agriculture is low.45 NITI Aayog has noted that Indian farmers use about three to five times the water used by American, Chinese or Israeli farmers to produce the same amount of crops.[46] The Standing Committee on Agriculture (2024) has also noted that efficiency of water use in agriculture needs to be increased.[47] See the section on groundwater management on page 6.
River Pollution
A study by the Central Pollution Control Board (2022) showed that 46% of the rivers (279 out of 603) were identified as polluted.[48] This was better than 70% rivers in 2015 (275 out of 390). In 2022, there were more than 300 polluted stretches in about 280 rivers across 30 states and Union Territories. Maharashtra, Madhya Pradesh, Bihar, and Kerala had the highest number of polluted river stretches. Gujarat and Uttar Pradesh had the highest number of priority I polluted stretches.48 Priority I stretches have the highest level of pollution where the Biochemical Oxygen Demand (an index of organic pollution in water) is more than 30 mg/litre. The number of polluted river stretches has decreased from 351 in 2016-17 to 311 in 2019-21. However, the number of priority I stretches have remained almost same.48
Table 5 : Number of polluted river stretches in states
|
State |
Number of polluted river stretches |
State |
Number of polluted river stretches |
|
Andhra Pradesh |
3 |
Maharashtra |
55 |
|
Assam |
10 |
Manipur |
13 |
|
Bihar |
18 |
Meghalaya |
7 |
|
Chhattisgarh |
6 |
Mizoram |
3 |
|
DNH & DD |
1 |
Nagaland |
4 |
|
Delhi |
1 |
Odisha |
7 |
|
Goa |
6 |
Puducherry |
3 |
|
Gujarat |
13 |
Punjab |
5 |
|
Haryana |
3 |
Rajasthan |
14 |
|
Himachal Pradesh |
9 |
Tamil Nadu |
10 |
|
J&K |
8 |
Telangana |
9 |
|
Jharkhand |
9 |
Tripura |
1 |
|
Karnataka |
17 |
Uttar Pradesh |
17 |
|
Kerala |
18 |
Uttarakhand |
9 |
|
Madhya Pradesh |
19 |
West Bengal |
13 |
Note: DNH & DD – Dadra and Nagar Haveli & Daman and Diu.
Source: Polluted River Stretches for Restoration of Water Quality, 2022, Central Pollution Control Board; PRS.
Water Quality of the Ganga and the Yamuna: A PAC report (2024) noted an improvement in the quality of Ganga river water between 2018 and 2020.37 As per the Central Pollution Control Board (CPCB), in 2018, there were four polluted stretches in the Ganga, with priority from III to V. In 2020, there are only two stretches, both of priority V (the lowest pollution criteria used by the CPCB).37 In 2022, the CPCB observed that dissolved oxygen levels (a higher value indicates better river health ) were within acceptable limits, and could support the river ecosystem for almost the entire stretch of the river Ganga.[49] Biochemical Oxygen Demand was also found to be within acceptable limits, except in two stretches.49
The Standing Committee on Water Resources (2024) took note of several practices contributing to erosion and pollution of stretches of the Yamuna.[50] It noted dumping of bio-medical waste and construction and demolition debris into the Yamuna. Sludge samples collected from Yamuna in Delhi, were found to have high levels of lead, copper, zinc, and other heavy metals.50 Untreated sewage also flows into the river from municipalities and unauthorised colonies. The Committee also noted that dissolved oxygen, which indicates whether a river is alive or not, is almost non-existent in Delhi.50 The Committee called for urgent and coordinated action by all stakeholders to address the issue.
Groundwater Management
Groundwater contributes to 80% of India’s rural drinking water, and 50% urban drinking water.33 87% of ground water extracted in 2022-23 was used for irrigation.[51]
Figure 5 : Extracted groundwater is largely used for irrigation
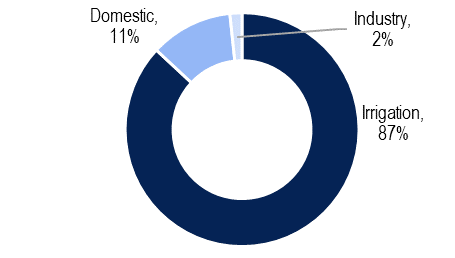
Source: Central Ground Water Board, Data for assessment year 2022-23, Ministry of Jal Shakti; PRS.
The stage of ground water extraction in the country, as of 2023, is 59%.[52] This indicates the proportion of extractable ground water that was extracted in 2023. 11% of units (blocks/mandals/taluks) were over-exploited.52 In these units, more water was extracted than could be recharged. 3% of units were critical, and 11% were semi-critical. Over-exploited units were concentrated in north-western India, western India, and in the southern part of India.52 In western and southern India, groundwater availability is low due to geological and climatic factors. However, in north-western India, units were over-exploited despite having sufficient resources for ground water recharge.52
In particular, over extraction of groundwater was found to be prevalent in Punjab, Haryana and Rajasthan, where 95%, 89% and 85% of groundwater is used for irrigation (see Annexure II).33,52 The Standing Committee on Water Resources (2023) noted that the primary reason for this was the cultivation of water-intensive crops, such as paddy and sugarcane.33 Production of such crops is incentivised through: (i) subsidised electricity, without penalties for indiscriminate extraction of ground water, (ii) subsidised fertilisers, and (iii) assured procurement.33 Usage of such water is also inefficient. For instance, the water requirement of sugarcane in India is 1800 mm – 2400 mm, while the requirement in Brazil is 1059 mm – 1640 mm.33
Figure 6 : Net sown area of water-intensive crops was more than 50% of total net sown area in 2019-20
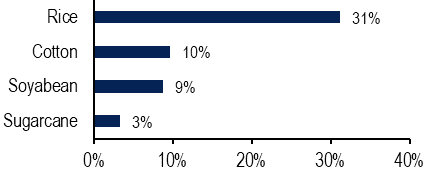
Source: Agriculture Statistics at a Glance, 2022, Department of Agriculture and Farmer’s Welfare; PRS.
Groundwater pollution
In 2022-23, more than 10 states had reported pollution of their ground water sources, due to contamination by domestic and industrial effluents, and the excessive use of chemical fertilisers and pesticides.33 Heavy metals like uranium have also been found in quantities above the permissible limits in areas where ground water is being used for drinking.33 The Central Pollution Control Board also attributed uncontrolled increase in population and waste water generation as reasons for this.33 The Standing Committee on Water Resources (2023) noted that little progress had been made to reduce ground water pollution.33 It also noted that the absence of a water pollution policy, sharing of aquifers between states, and the involvement of multiple agencies at the central and state level have further added to the problem.
Flood management
India faces floods of various magnitudes every year. The Central Water Commission recorded 184 extreme and severe floods in 2022, and 145 in 2021.[53] Floods are caused by natural factors, such as excessive rainfall, low carrying capacities of rivers, poor natural drainage, glacial lake outbursts, etc.[54] However, the effects of floods may be aggravated by human action, like encroachment of riverine areas, deforestation, and destruction of wetlands.54 Additionally, global warming has increased extreme weather activity, like localised heavy rainfall.53
Flood management is presumed to fall under the jurisdiction of state governments as ‘drainage and embankments’ is in the State List of the Constitution (barring regulation and development of inter-state rivers and river valleys).54 The central government provides financial assistance to states to implement some projects in critical areas though the Flood Management and Border Areas Programme (FMBAP). As of July 2024, there are 54 projects ongoing under FMBAP across 12 states and Union Territories.[55]
In 2024, the Public Accounts Committee examined a CAG report which audited flood management programmes across the country.[56] The Committee noted that the government of India had set up various Committees, task forces, and working groups for flood management. The National Water Policy (2012) was also framed. However, several recommendations of these bodies remained unfulfilled.56
The Committee noted that some states, such as Bihar, Himachal Pradesh and Tamil Nadu had not undertaken flood forecasting activities.56 In eight states, Detailed Project Reports were not prepared as per scheme guidelines. Delays in the approval of project reports led to consequent delays in implementation of projects.56 The Committee also noted that the Central Water Commission had circulated a model Bill on flood plain zoning to states in 1975. Only four states, Manipur, Rajasthan, Uttarakhand, and the former state of Jammu and Kashmir enacted the model Bill.56 The Committee recommended that an Expert Committee comprised of environmentalists, geologists, and other scientists be constituted to prepare an action plan to enhance flood forecasting and management activities.56
Monitoring of Glaciers
Between 2013 and 2023, Ladakh, Sikkim, and Uttarakhand have experienced disasters related to glaciers.[57] In recent years, Himalayan glaciers have been melting at a faster rate, leading to an increase in water runoff and sediment load.[58] The Standing Committee on Water Resources (2023) noted that there are several bodies monitoring Himalayan glaciers with different mandates.58 This includes the Geological Survey of India, the Ministry of Jal Shakti, the Ministry of Mines, the Ministry of Earth Sciences, and the Ministry of Environment, Forests, and Climate Change. They also noted that there is a need to create a single nodal agency which can coordinate glacial research and monitoring.58 The Committee also recommended that agreements be signed with neighbouring countries, to enable sharing of data related to glaciers and runoff evolution.58
River Interlinking
Interlinking of rivers involves the transfer of water from water-surplus river basins to water-deficit basins. In 1980, the National Water Development Agency identified 30 projects for river inter-linking in accordance with the National Perspective Plan for the creation of feasibility reports.[59] The National Perspective Plan, 1980 looks at water resource development that is carried out via inter-basin transfers. Detailed Project Reports have been prepared for 11 river links.59 However, implementation has started only on the Ken-Betwa Link Project, which was approved by the central government in 2021, with an estimated cost of Rs 44,605 crore.[60] As of March 2023, total expenditure on the project was Rs 7,998 crore. The project is expected to be completed by March 2030.
In 2024-25, Rs 3,500 crore has been allocated towards the river interlinking project, more than twice the revised estimates for 2023-24 (Rs 1,400 crore).5 In 2023-24, the allocation was the same at Rs 3,500 crore which was reduced down to Rs 1,400 crore at the revised estimate stage. According to the Ministry, the allocation was increased from 2022-23 to cater to the expenditure on land acquisition for Phase-I which is likely to be completed in 2023-24 and funding for civil works of some other projects.32
The Standing Committee on Water Resources (2021) had observed implementation problems with river interlinking including: (i) lack of consensus among states concerned for interlinking, (ii) obtaining various statutory clearances, (iii) land acquisition, and (iv) rehabilitation of individuals displaced by the project.[61]
Annexure I
Table 6 : % of villages certified Har Ghar Jal and % households with regular water supply in each state
|
State/Union Territory |
% Villages certified Har Ghar Jal |
% Households with regular water supply |
State/Union Territory |
% Villages certified Har Ghar Jal |
% Households with regular water supply |
|
Andaman and Nicobar Islands |
100% |
85% |
Madhya Pradesh |
51% |
67% |
|
Andhra Pradesh |
77% |
79% |
Maharashtra |
63% |
75% |
|
Arunachal Pradesh |
100% |
85% |
Manipur |
48% |
57% |
|
Assam |
49% |
73% |
Meghalaya |
52% |
93% |
|
Bihar |
0% |
84% |
Mizoram |
82% |
79% |
|
Chhattisgarh |
36% |
85% |
Nagaland |
58% |
81% |
|
DNH & DD |
100% |
89% |
Odisha |
51% |
69% |
|
Goa |
100% |
93% |
Puducherry |
100% |
99% |
|
Gujarat |
91% |
88% |
Punjab |
100% |
82% |
|
Haryana |
100% |
83% |
Rajasthan |
47% |
66% |
|
Himachal Pradesh |
69% |
87% |
Sikkim |
50% |
89% |
|
Jammu and Kashmir |
47% |
70% |
Tamil Nadu |
76% |
93% |
|
Jharkhand |
47% |
70% |
Telangana |
0% |
93% |
|
Karnataka |
57% |
84% |
Tripura |
73% |
94% |
|
Kerala |
66% |
76% |
Uttar Pradesh |
66% |
67% |
|
Ladakh |
20% |
80% |
Uttarakhand |
44% |
71% |
|
Lakshadweep |
50% |
- |
West Bengal |
51% |
90% |
Note: DNH & DD – Dadra and Nagar Haveli & Daman and Diu
Source: Jal Jeevan Mission Dashboard, accessed on July 24, 2024; National Report of Functionality Assessment, 2022; PRS.
Annexure II
Table 7 : Stage of ground water extraction in each state and % of groundwater used for irrigation
|
State/Union Territory |
Stage of groundwater development |
% groundwater used for irrigation |
State/Union Territory |
Stage of groundwater development |
% groundwater used for irrigation |
|
Andaman and Nicobar Islands |
1% |
1% |
Lakshadweep |
62% |
0% |
|
Andhra Pradesh |
28% |
86% |
Madhya Pradesh |
59% |
90% |
|
Arunachal Pradesh |
0.4% |
50% |
Maharashtra |
54% |
92% |
|
Assam |
13% |
78% |
Manipur |
8% |
43% |
|
Bihar |
45% |
74% |
Meghalaya |
5% |
29% |
|
Chandigarh |
75% |
22% |
Mizoram |
4% |
0% |
|
Chhattisgarh |
47% |
85% |
Nagaland |
4% |
11% |
|
Dadra and Nagar Haveli |
132% |
9% |
Odisha |
46% |
40% |
|
Daman and Diu |
171% |
5% |
Puducherry |
70% |
54% |
|
Delhi |
99% |
24% |
Punjab |
164% |
95% |
|
Goa |
21% |
37% |
Rajasthan |
149% |
85% |
|
Gujarat |
52% |
92% |
Sikkim |
6% |
75% |
|
Haryana |
136% |
89% |
Tamil Nadu |
74% |
93% |
|
Himachal Pradesh |
35% |
51% |
Telangana |
39% |
89% |
|
Jammu and Kashmir |
24% |
30% |
Tripura |
10% |
27% |
|
Jharkhand |
31% |
52% |
Uttar Pradesh |
71% |
88% |
|
Karnataka |
66% |
89% |
Uttarakhand |
52% |
71% |
|
Kerala |
55% |
41% |
West Bengal |
45% |
84% |
|
Ladakh |
37% |
0% |
|
|
|
Source: National Compilation on Dynamic Ground Water Resources of India, 2023, Central Pollution Control Board; PRS.
[1] Seventh Schedule, Constitution of India.
[2] Introduction, Department of Water Resources, River Development, and Ganga Rejuvenation, Ministry of Jal Shakti, accessed on July 22, 2024, https://jalshakti-dowr.gov.in/about-department/introduction/.
[3] About Us, Department of Drinking Water and Sanitation, Ministry of Jal Shakti, accessed on February 12, 2023, https://jalshakti-ddws.gov.in/en/about-us.
[4] History, Department of Water Resources, River Development, and Ganga Rejuvenation, Ministry of Jal Shakti, accessed on February 12, 2023, https://jalshakti-dowr.gov.in/about-us/history.
[5] Demand No. 62, Department of Water Resources, River Development, and Ganga Rejuvenation, Ministry of Jal Shakti, Union Budget 2024-25, https://www.indiabudget.gov.in/doc/eb/sbe62.pdf.
[6] Demand No. 63, Department of Drinking Water and Sanitation, Ministry of Jal Shakti, Union Budget 2024-25, https://www.indiabudget.gov.in/doc/eb/sbe63.pdf.
[7] Jal Jeevan Mission (JJM), Department of Drinking Water and Sanitation, https://jaljeevanmission.gov.in/.
[8] Demand No. 63, Department of Drinking Water and Sanitation, Ministry of Jal Shakti, Union Budget 2023-24, https://www.indiabudget.gov.in/budget2023-24/doc/eb/sbe63.pdf.
[9] JJM Dashboard, last accessed on July 28, 2024, https://ejalshakti.gov.in/jjmreport/JJMIndia.aspx.
[10] National Report of Functionality Assessment, 2022, Ministry of Jal Shakti, https://jaljeevanmission.gov.in/sites/default/files/2022-10/national_report_of_functionality_assessment_2022.pdf.
[11] Report No. 21, Standing Committee on Water Resources: “Ministry of Jal Shakti, Department of Drinking Water and Sanitation, Demands for Grants (2023-24)”, Lok Sabha, March 20, 2023, https://sansad.in/getFile/lsscommittee/Water%20Resources/17_Water_Resources_21.pdf?source=loksabhadocs.
[12] Report No. 19, Standing Committee on Water Resources: “Ministry of Jal Shakti-Department of Drinking Water and Sanitation, Demands for Grants (2022-23), Action Taken by the Government on the Observations / Recommendations contained in the Sixteenth Report (Seventeenth Lok Sabha) of the Standing Committee on Water Resources”, Lok Sabha, February 10, 2023, https://loksabhadocs.nic.in/lsscommittee/Water%20Resources/17_Water_Resources_19.pdf.
[13] Report No. 28, Standing Committee on Water Resources: “Ministry of Jal Shakti – Department of Drinking Water and Sanitation Demands For Grants (2023-24), Action Taken By the Government on the Observations / Recommendations Contained In the Twenty-First Report (Seventeenth Lok Sabha) of the Standing Committee on Water Resources”, Lok Sabha, February 6, 2024, https://sansad.in/getFile/lsscommittee/Water%20Resources/17_Water_Resources_28.pdf?source=loksabhadocs.
[14] Definitions, Operational Guidelines for the Implementation of Jal Jeevan Mission, Ministry of Jal Shakti, December 2019, https://jaljeevanmission.gov.in/sites/default/files/jjm_ebook/mobile/index.html#p=19.
[15] Unstarred Question No. 1017, Ministry of Jal Shakti, Lok Sabha, February 8, 2024, https://sansad.in/getFile/loksabhaquestions/annex/1715/AU1017.pdf?source=pqals.
[16] Swachh Bharat Mission (Grameen) FAQ, Ministry of Jal Shakti, https://swachhbharatmission.ddws.gov.in/faq#:~:text=The%20Government%20launched%20Swachh%20Bharat,India%20by%202nd%20October%202019.
[17] “Open Defecation Free Villages”, Press Information Bureau, Ministry of Jal Shakti, August 4, 2022, https://pib.gov.in/Pressreleaseshare.aspx?PRID=1848437.
[18] Swachh Bharat Mission-Grameen (SBM): Phase II (2019-2025), Swachh Bharat Mission (Grameen), Department of Drinking Water & Sanitation, Ministry of Jal Shakti, https://swachhbharatmission.ddws.gov.in/about_sbm.
[19] Table 2.2, National Family Health Survey-5, https://dhsprogram.com/pubs/pdf/FR375/FR375.pdf.
[20] “Cabinet approves SMB-G Phase II”, Press Information Bureau, Cabinet, February 19, 2020, https://pib.gov.in/PressReleasePage.aspx?PRID=1603628#:~:text=SBM%20(G)%20Phase%2DII,between%20different%20verticals%20of%20financing.
[21] SMB-G Dashboard, as accessed on July 25, 2024, https://sbm.gov.in/sbmgdashboard/statesdashboard.aspx.
[22] Swachh Bharat Mission – (Grameen) Phase II Operational Guidelines, Ministry of Jal Shakti, 2020, https://lsba.bih.nic.in/LSBAPayment/sbmj/Notice/SBM-%20Phase-2%20Guidelines.pdf.
[23] Unstarred Question No. 1124, Ministry of Jal Shakti, Lok Sabha, February 8, 2024, https://eparlib.nic.in/bitstream/123456789/2974211/1/AU1124.pdf.
[24] F. No. 1(13)/PFMS/2020, Department of Expenditure, Ministry of Finance, February 16, 2023, https://doe.gov.in/files/public-finance-state-cna-sna-document/OM_dated_16_02_2023_to_all_chief_secys.pdf.
[25] Department of Water Resources Homepage, Ministry of Jal Shakti, as accessed on May 25, 2024, https://jalshakti-dowr.gov.in/.
[26] “PMKSY Pradhan Mantri Krishi Sinchayee Yojana”, Press Information Bureau, Ministry of Jal Shakti, August 4, 2022, https://pib.gov.in/PressReleaseIframePage.aspx?PRID=1848470.
[27] “Assistance to States Under AIBP”, Press Information Bureau, Ministry of Jal Shakti, March 18, 2021, https://pib.gov.in/PressReleasePage.aspx?PRID=1705787.
[28] “Status of PMKSY”, Ministry of Jal Shakti, December 4, 2023, Press Information Bureau, https://pib.gov.in/PressReleaseIframePage.aspx?PRID=1982446.
[29] Starred Question No. 162, Ministry of Jal Shakti, Rajya Sabha, December 18, 2023, https://rsdebate.nic.in/bitstream/123456789/745177/1/PQ_262_18122023_S162_p45_p50.pdf.
[30] Atal Bhujal Yojana, Ministry of Jal Shakti, accessed on July 28, 2024, https://ataljal.mowr.gov.in/.
[31] Atal Bhujal Yojana Dashboard, accessed on July 28, 2024, https://ataljal-mis.mowr.gov.in/Dashboard/Dashboard?clear=1705303253898.
[32] Report No. 20, Standing Committee on Water Resources: “Demands for Grants (2023-24)”, Lok Sabha, March 20, 2023, https://sansad.in/getFile/lsscommittee/Water%20Resources/17_Water_Resources_20.pdf?source=loksabhadocs.
[33] Report No. 22, Standing Committee on Water Resources: “Groundwater: A Valuable but Diminishing Resource”, Lok Sabha, March 2023, https://loksabhadocs.nic.in/lsscommittee/Water%20Resources/17_Water_Resources_22.pdf.
[34] Namami Gange, National Mission for Clean Ganga, Ministry of Jal Shakti, https://nmcg.nic.in/NamamiGanga.aspx.
[35] Namami Gange Dashboard, National Mission for Clean Ganga, accessed on July 28, 2024, https://gisnmcg.mowr.gov.in/pmt/nmcgpmtmain.aspx.
[36] Report No. 39 of 2017, Performance Audit of Rejuvenation of River Ganga (Namami Gange), CAG, December 19, 2017, https://cag.gov.in/uploads/download_audit_report/2017/Report_No.39_of_2017_-_Performance_Audit_on_Ministry_of_Water_Resources,_River_Development_&_Ganga_Rejuvenation_Union_Government.pdf.
[37] Report No. 125, Public Accounts Committee: “Rejuvenation of River Ganga (Namami Gange)”, Lok Sabha, February 23, 2024, https://sansad.in/getFile/lsscommittee/Public%20Accounts/17_Public_Accounts_125.pdf?source=loksabhadocs.
[38] M.C. Mehta v. Union of India & Ors., Original Application No. 200/2014, National Green Tribunal, New Delhi, July 22, 2022, https://greentribunal.gov.in/gen_pdf_test.php?filepath=L25ndF9kb2N1bWVudHMvbmd0L2Nhc2Vkb2Mvb3JkZXJzL0RFTEhJLzIwMjItMDctMjIvY291cnRzLzEvZGFpbHkvMTY1ODU4NzUyOTEzODAyMDI5MjM2MmRjMDk4OTU0MDEzLnBkZg==.
[39] Pollution Threat, National Mission for Clean Ganga, https://nmcg.nic.in/pollution.aspx.
[40] “National Mission For Clean Ganga Targets Cumulative Sewerage Treatment Capacity Of 7,000 MLD By December, 2026”, Press Information Bureau, Ministry of Jal Shakti, December 14, 2023, https://pib.gov.in/PressReleaseIframePage.aspx?PRID=1986271#:~:text=Under%20Namami%20Gange%20Programme%2C%20in,Treatment%20Plant%20(STP)%20capacity.
[41] “Shortage of Water”, Press Information Bureau, Ministry of Water Resources, River Development and Ganga Rejuvenation, March 12, 2020, https://pib.gov.in/PressReleasePage.aspx?PRID=1606099.
[42] Water and Related Statistics-2021, Central Water Commission, Ministry of Jal Shakti, October, 2021, https://cwc.gov.in/sites/default/files/water-and-related-statistics-2021compressed-2.pdf.
[43] Report of the 15th Finance Commission for 2021-26, https://fincomindia.nic.in/asset/doc/commission-reports/XVFC%20VOL%20I%20Main%20Report.pdf.
[44] “Assistance for Conservation of Water Resources”, Press Information Bureau, Ministry of Jal Shakti, August 5, 2021, https://pib.gov.in/PressReleseDetail.aspx?PRID=1742813#:~:text=85%2D90%25%20of%20the%20total,Water%20Resource%20is%20398%20BCM.
[45] Agricultural Statistics at a Glance 2022, Ministry of Agriculture & Farmers’ Welfare, April 2023, https://agriwelfare.gov.in/Documents/CWWGDATA/Agricultural_Statistics_at_a_Glance_2022_0.pdf.
[46] Composite Water Management Index, NITI Aayog, August 2019, https://social.niti.gov.in/uploads/sample/water_index_report2.pdf.
[47] Report No. 68, Standing Committee on Agriculture, Animal Husbandry and Food Processing: “Promotion of Climate Resilient Farming”, Lok Sabha, February 7, 2024, https://sansad.in/getFile/lsscommittee/Agriculture,%20Animal%20Husbandry%20and%20Food%20Processing/17_Agriculture_Animal_Husbandry_and_Food_Processing_68.pdf?source=loksabhadocs.
[48] Polluted River Stretches for Restoration of Water Quality, Central Pollution Control Board, November 2022, https://cpcb.nic.in/openpdffile.php?id=UmVwb3J0RmlsZXMvMTQ5OF8xNjcyOTg4MDQ1X21lZGlhcGhvdG8xMjk5NS5wZGY=.
[49] “Improvement in Water Quality of Ganga under NMCG”, Press Information Bureau, Ministry of Jal Shakti, March 13, 2023, https://pib.gov.in/PressReleaseIframePage.aspx?PRID=1906491#:~:text=Based%20on%20the%20water%20quality,quality%20criteria%20and%20satisfactory%20to.
[50] Report No. 27, Standing Committee on Water Resources: “Review of Upper Yamuna Cleaning Projects Up to Delhi and River Bed Management in Delhi”, Lok Sabha, February 6, 2024, https://sansad.in/getFile/lsscommittee/Water%20Resources/17_Water_Resources_27.pdf?source=loksabhadocs.
[51] Central Ground Water Board Dashboard, accessed on July 26, 2024, https://ingres.iith.ac.in/gecdataonline/gis/INDIA;parentLocName=INDIA;locname=INDIA;loctype=COUNTRY;view=ADMIN;locuuid=ffce954d-24e1-494b-ba7e-0931d8ad6085;year=2022-2023;computationType=normal;component=recharge;period=annual;category=safe;mapOnClickParams=false;login=true;stateuuid=true.
[52] Dynamic Ground Water Resources of India, 2023, Central Ground Water Board, Ministry of Jal Shakti, https://cgwa-noc.gov.in/LandingPage/LatestUpdate/NCDGWR2023.pdf.
[53] Unstarred Question 60, Lok Sabha, Ministry of Jal Shakti, July 20, 2023, https://sansad.in/getFile/loksabhaquestions/annex/1712/AU60.pdf?source=pqals.
[54] Report No. 12, Standing Committee on Water Resources: “Flood Management in the Country including International Water Treaties in the field of Water Resource Management with particular reference to Treaty/Agreement entered into with China, Pakistan And Bhutan”, Lok Sabha, August 5, 2023, https://loksabhadocs.nic.in/lsscommittee/Water%20Resources/17_Water_Resources_12.pdf.
[55] Flood Management & Border Areas Programme Dashboard, accessed on July 25, 2023, https://pmksy-mowr.nic.in/fmbap/.
[56] Report No. 143, Public Accounts Committee: “Performance Audit on Schemes for Flood Control and Flood Forecasting”, Lok Sabha, April 29, 2024, https://sansad.in/getFile/lsscommittee/Public%20Accounts/17_Public_Accounts_143.pdf?source=loksabhadocs.
[57] “Risks of natural disasters due to melting of glaciers”, Press Information Bureau, Ministry of Environment, Forests, and Climate Change, July 25, 2024, https://pib.gov.in/PressReleaseIframePage.aspx?PRID=2036724.
[58] Report No. 23, Standing Committee on Water Resources: “Glacier Management in the Country”, Lok Sabha, https://sansad.in/getFile/lsscommittee/Water%20Resources/17_Water_Resources_23.pdf?source=loksabhadocs.
[59] Unstarred Question No. 1098, Lok Sabha, Ministry of Jal Shakti, answered on February 8, 2024, https://eparlib.nic.in/bitstream/123456789/2974241/1/AU1098.pdf.
[60] “Interlinking of Rivers”, Press Information Bureau, Ministry of Jal Shakti, March 27, 2023, https://pib.gov.in/PressReleaseIframePage.aspx?PRID=1911227.
[61] Report No. 6, Standing Committee on Water Resources: “Action Taken Report on the Demands for Grants (2019-20)”, Lok Sabha, February 9, 2021, https://sansad.in/getFile/lsscommittee/Water%20Resources/17_Water_Resources_6.pdf?source=loksabhadocs.
DISCLAIMER: This document is being furnished to you for your information. You may choose to reproduce or redistribute this report for non-commercial purposes in part or in full to any other person with due acknowledgement of PRS Legislative Research (“PRS”). The opinions expressed herein are entirely those of the author(s). PRS makes every effort to use reliable and comprehensive information, but PRS does not represent that the contents of the report are accurate or complete. PRS is an independent, not-for-profit group. This document has been prepared without regard to the objectives or opinions of those who may receive it.