

The Ministry of Science and Technology has three departments: (i) Department of Science and Technology (DST), (ii) Department of Scientific and Industrial Research (DSIR), and (iii) Department of Biotechnology (DBT). DST is responsible for promoting new areas of science and technology, coordinating, and integrating areas of science and technology having cross-sectoral linkages. It formulates and implements policies for the promotion of science, technology, research, and innovation in the country. DSIR is responsible for promotion, development, and transfer of indigenous technology. The Council for Scientific and Industrial Research (CSIR) is an autonomous body under DSIR which undertakes research and development in diverse areas. DBT is entrusted with promotion and development of biotechnology.
India’s expenditure on Research and Development (R&D) activities remains low in comparison to developed countries.[1] Further, the R&D sector in India faces issues such as: (i) inadequate investment by private sector and state governments, (ii) low number of researchers, (iii) talent migration, and (iv) low share in patents and high-quality scientific publications.6 In this note, we examine expenditure by the three Departments under the Ministry and discuss key issues in the sector.
Overview of Finances[2],[3],[4]
Expenditure
In 2024-25, the Ministry of Science and Technology has been allocated Rs 16,628 crore. This comprises: (i) Rs 8,029 crore to DST (48% of the total), (ii) Rs 6,323 crore to DSIR (38%), and (iii) Rs 2,276 crore to DBT (14%). Total allocation to the Ministry is estimated to increase by 31% over the revised estimates for 2023-24. Allocation to DST and DBT are estimated to increase by 64% and 42%, respectively, while the corresponding increase for DSIR is 2%. Almost entire expenditure under the Ministry is revenue expenditure (more than 99%).
Under DST, the highest allocation is towards the National Research Foundation followed by autonomous bodies (see Table 1). 99% of the amount allocated to DSIR is for CSIR. Of the Rs 2,251 crore allocated to DBT, 48% is towards biotechnology research and development, and 41% towards assistance to autonomous institutions.
The revised estimates for 2024-25 show a significant reduction from the budget estimate in some areas. For example, in 2023-24, the NRF allocation decreased from Rs 2,000 crore at the budget stage in 2023-24 to Rs 259 crore at the revised estimate stage. Allocation for Research and Development under DST reduced from Rs 592 crore at the budget stage in 2023-24 to Rs 200 crore. See Tables 3, 4 and 5 in the annexure for more details.
Table 1: Overview of Allocation (in Rs crore)
|
Department |
22-23 Actual |
23-24 RE |
24-25 BE |
% Change (23-24 RE to 24-25 BE) |
|
DST |
4,436 |
4,892 |
8,029 |
64% |
|
National Research Foundation |
-- |
259 |
2,000 |
673% |
|
Autonomous bodies |
1,247 |
1,618 |
1,612 |
0% |
|
Institutional and human capacity building |
770 |
500 |
900 |
80% |
|
National Quantum Mission |
-- |
5 |
427 |
8440% |
|
DSIR |
5,852 |
6,202 |
6,323 |
2% |
|
CSIR |
5,804 |
6,141 |
6,266 |
2% |
|
DBT |
2,045 |
1,607 |
2,276 |
42% |
|
Biotechnology research and development |
969 |
500 |
1,100 |
120% |
|
Autonomous institutions |
849 |
911 |
941 |
3% |
|
Total |
12,333 |
12,701 |
16,628 |
31% |
Note: BE: Budget Estimates; RE: Revised Estimates. Autonomous Bodies under DST includes Indian National Science Academy, Bose Institute, Kolkata and others. Autonomous Bodies under DBT includes National Institute of Immunology, National Centre for Cell Science and others.
Sources: Union Budget 2024-25; PRS.
Trends in Expenditure
The growth in the expenditure of the Ministry has been variable during the last decade (Figure 1). During the 2014-24 period, the annualised increase in expenditure by the Ministry was 6%. For DST it was 9%, for DSIR it was 4% and for DBT it was 2%.2,3,4
Figure 1: Growth in expenditure-Ministry of Science and Technology (in Rs crore)

Note: Expenditure for 2023-24 is as per revised estimates.2024-25 is as per Budget estimate
Sources: Union Budget of various years; PRS.
Actual spending has been lower
During the 2018-24 period (six years), on average, DST spent 18% less than the budget estimates (Figure 2). The corresponding figures for DSIR and DBT are 3% and 18% respectively.
Figure 2: Actual Spending has been lower than the allocated money

Sources: Union Budget of various years; PRS.
Issues to consider
India’s expenditure on research and development has been declining
Investment in science is measured in terms of gross expenditure on research and development (GERD).[5] This includes expenditure on research and development by business enterprises, higher education institutions, governments, and private non-profit organisations. GERD as a percentage of GDP has been declining since 2009-10 (see Figure 3). In 2020-21, GERD was estimated to be 0.64% of the GDP.[6]
Figure 3: GERD falling since 2009-10 (figures in % of GDP)

Sources: Research and Development Statistics 2022-23; Ministry of Science and Technology; PRS.
The Science, Technology, and Innovation Policy, 2013 noted that it has been a long-standing national goal to increase gross expenditure on research and development (GERD) to 2% of GDP. This Policy is managed by the Ministry of Science and Technology.[7] The latest draft of the Science, Technology, and Innovation Policy, 2020 aims to double the domestic GERD every five years.[8]
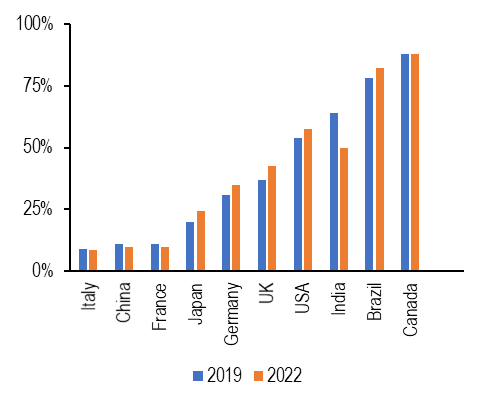
A NITI Aayog (2021) report noted that a higher per capita R&D expenditure leads to higher per capita GDP.[9] In 2019, India’s GERD was significantly lower than that of countries such as Germany, USA, China, and Brazil (see Figure 4). However, India's GERD is higher than the average for lower-middle-income group countries.
Figure 4: India’s GERD as a % of GDP is among the lowest (2019)

Note: Data for lower middle-income countries is from 2017. Sources: World Bank; PRS.
NITI Aayog (2021) observed that resources are often diverted towards competing and more pressing priorities such as hunger, disease control, and quality of life. This leads to low spending on R&D, where it takes time to produce results.9
Public Sector contribution to GERD
Public sector expenditure includes expenditure by: (i) all central government ministries, (ii) public sector units, (iii) state governments, and (iv) higher education institutes. The Science, Technology, and Innovation Policy, 2013 noted that the public sector has been the major spender on R&D as compared to the private sector in the country.7 But expenditure by the public sector has been on a decline since 2008-09 (see Figure 5).
Figure 5: Expenditure by the Public Sector on R&D declining (figures in % of GDP)

Sources: Research and Development Statistics 2022-23; Ministry of Science and Technology; PRS.
Private Sector contribution to GERD
The Science, Technology, and Innovation Policy, 2013 noted the need for increased private sector investment in research and development (R&D). It highlighted that greater private investment is essential for turning R&D findings into commercial successes.7 The expenditure on R&D by the private sector has been stagnant at around 0.25% of GDP (see Figure 6).
Figure 6: Expenditure by private sector on R&D has remained stagnant (figures in % of GDP)

Sources: Research and Development Statistics 2022-23; Ministry of Science and Technology; PRS.
NITI Aayog (2018) noted that low private sector R&D investment is one of the major challenges in developing the innovation ecosystem in the country.[10] The draft Science, Technology, and Innovation Policy, 2020 aimed to double the private sector contribution to GERD within five years.8
From October 2019, companies are permitted to utilise their corporate social responsibility (CSR) funds for making contributions towards research.[11] These funds can be allocated as contributions to public-funded incubators, research organisations, and universities involved in research in the fields of science, technology, engineering, and medicine.
In countries where R&D investment is 2% or more of their GDP, over 50% of the investments come from the private sector.5 The Economic Survey (2017-18) pointed out that in countries such as the USA, China, Germany, and Japan, the private sector’s contribution to overall research and development spending is notably higher.5 In India, the private sector contributes 36% while the government covers the remaining 64% of national R&D expenditure (Figure 7).
Figure 7: Share of public investment in R&D more than private investment

Sources: Research and Development Statistics 2022-23; Ministry of Science and Technology; PRS.
Sales turnover spending on R&D
Sales turnover is a company’s total amount of product or services sold in a certain period. Public sector companies spend a smaller proportion of their sales turnover on R&D compared to private sector companies (Figure 8). In 2020-21, private sector companies spent 1.46% of their sales turnover on R&D, whereas public sector companies spent 0.3%. These figures for both sectors have remained almost stagnant between 2015 and 2021.
Figure 8: Private sector spends higher share of sales turnover on R&D (figures in %)

Note: Data for Public Sector refers to 94 industrial R&D units. Data for Private Sector refers to 1,866 industrial units and 446 SIROs.
Sources: Research and Development Statistics 2022-23; Ministry of Science and Technology; PRS.
Low investment by state governments in R&D
The Economic Survey (2017-18) noted that most of the government expenditure on R&D is carried out by the central government. It recommended that there is a need for increased R&D spending by state governments.5 In 2020-21, the share of state government in national R&D expenditure was 7%.6
Spending on R&D by state government vary significantly. Uttar Pradesh, Gujarat, Punjab, Maharashtra, Tamil Nadu, Andhra Pradesh, Kerala, and Karnataka together accounted for over 60% of the total R&D expenditure.6
Figure 9: Sector-wise source of funds for R&D

Note: Central sector includes expenditure by central ministries and central public sector units. State sector includes spending by the state ministries/organisations and state agricultural universities. Examples of Higher Education Institutes are IITs and Indian Institute of Science, Bangalore.
Sources: Research and Development Statistics 2022-23; Ministry of Science and Technology; PRS.
Low number of researchers per million people
India has a lower number of researchers per million people compared to several other countries. In 2015, it was 260 (Figure 10). In comparison, the numbers for the USA and China were 4,452 and 1,602, respectively. India’s figure is also less than the average for middle-income group countries, which was 876 in 2020.[12] The Economic Survey (2017-18) emphasised the need for significant improvements in mathematics and cognitive skills at the primary and secondary education levels to foster the R&D ecosystem in the country.5 The Survey also noted the issue of migration of researchers outside India due to better oppurtunities.5
Figure 10: Researchers per million people (2020)

Sources: World Bank; PRS.
India’s gross enrolment ratio (GER) in higher education is relatively lower. In the academic year 2021-22, India's GER in higher education was 28.4%.[13] In contrast, the GER in higher education in countries like the USA, China, and Germany was 88%, 49%, and 70% respectively.[14] The National Education Policy, 2020 aims to increase the GER in higher education to 50% by 2035. The National Education Policy 2020 also focuses on enhancing foundational literacy, numeracy, and cognitive capacities of students.[15]
Emerging areas for R&D
Over time, committees and reports have highlighted artificial intelligence, blockchain, and other areas as emerging areas for R&D. The draft Science and Tech Policy, 2020 highlighted India’s high dependency on technology imports.8 It stressed upon the need to focus on: (i) developing indigenous technology, (ii) providing sustainable solutions through technology, and (iii) promoting technologies like blockchain and artificial intelligence.8 NITI Aayog (2021) has also recommended encouraging research and development in emerging fields such as artificial intelligence, automation, and cybersecurity.[16] The Ministry of Electronics and Information Technology report on the AI ecosystem highlights the necessary requirements for building an ecosystem for AI development in India. The report notes the following requirements: (i) Availability of well-trained and contemporary workforce, (ii) infrastructural resources such as better computing power and network connectivity, (iii) an enabling regulatory environment, (iv) industry, government, and startup demand for creating jobs and products, which will increase the demand for AI.[17]
Table 2: National research expenditure by areas
|
Sector |
% share in 2019-20 |
|
Health |
19% |
|
Defence |
17% |
|
Agriculture, forestry, and fishing |
13% |
|
Industrial production and technology |
12% |
|
Exploration of Space |
11% |
|
Energy |
7% |
|
General advancement of knowledge |
6% |
|
Transport, telecommunication and other infrastructure |
4% |
|
Environment |
0.4% |
|
Others |
10% |
Sources: Research and Development Statistics 2022-23; Ministry of Science and Technology; PRS.
In line with the focus on new emerging areas, recent R&D initiatives have been taken up across sectors such as: National Green Hydrogen Mission, National Quantum Mission, National Semiconductor Mission (see Table 6 in Annexure for details).
Barriers to innovation
The Department of Science and Technology and the United Nations Industrial Development Organization (UNIDO) have published a report based on a survey about sector-specific innovation barriers. This survey targeted the innovation systems of five key manufacturing sectors: Food and Beverages, Textiles and Apparel, Automotive, Pharmaceuticals, and Information and Communication Technologies (ICT).[18],[19],[20],[21],[22] These reports have identified key barriers to innovation across these sectors. Some common barriers identified in the report across such sectors include lack of access to and understanding of Industry 4.0 (I4.0) technologies, inadequate infrastructure, high costs of I4.0 technologies, absence of a clear national innovation strategy, and technology and knowledge gaps. Industry 4.0, also referred to as the Fourth Industrial Revolution (4IR), comprises a set of sophisticated and interconnected advanced digital production technologies such as the Internet of Things, big data, artificial intelligence, robotics, cloud computing, augmented reality, virtual reality, and cyber-physical systems.
Share in scientific publications
The Economic Survey (2017-18) highlighted the importance of scientific publications in evaluating research productivity and quality.5 As per the latest data available, India's share in global scientific publications has reached 5.1% in 2020.6 India’s average annual growth rate for scientific publications from 2010 to 2020 is 9.44%, higher than the world’s rate of 4.26%.6
The Economic Survey (2017-18) noted that India needs to enhance its high-quality research output, as measured by highly cited articles, in addition to increasing its publications.5 It highlighted that India significantly lags behind countries such as USA and China in this aspect.
Figure 11: Share in science and engineering publications (2020)

Sources: Research and Development Statistics 2022-23; Ministry of Science and Technology; PRS.
Low number of patents in India
The Economic Survey for 2017-18 pointed out that a country's technological standing can be reflected by its patents.28 Over the years, there has been a steady increase in the filing and granting of patents in India. The number of patents filed in India rose from 39,400 in 2010-11 to 80,211 in 2022-23, and the patents granted in India increased from 7,509 in 2010-11 to 34,134 in 2022-23.[23],[24]
Figure 12: Patents granted (2022)

Sources: IP India Annual Report 2022-23 - Indian Patent Office; PRS.
One of the main reasons for the relatively low number of patents in India is the low expenditure on research and development (R&D).6,24,[25] The Economic Survey (2021-22) noted that one of the reasons for the low number of patents in India is the procedural delays and complexity of the process.24 As of 2022, the average time taken for a final decision on acquiring patents in India is 51 months, which is considerably longer than in other countries (refer to Figure 13).[26] The average time for a final decision on acquiring patents in India has decreased from 64 months in 2017 to 51 months in 2022.24,26
Figure 13: Average pendency for final decision in acquiring patents (in months) (2022)

Sources: World Intellectual Property Indicators 2023 Report; PRS.
The Economic Survey (2021-22) highlighted the issue of delayed patent applications in India due to the low number of patent examiners.24
Figure 14: Number of patent examiners (2022)

Sources: World Intellectual Property Indicators, 2022; PRS
Need to increase resident share in Patent applications
A significant portion of Patent applications (64% in 2019 and 50% in 2022) was filed by non-residents, higher than those in countries such as China (10%) and Japan (24%).5 However, the share of resident applicants has been steadily increasing (Figure 15).5 The share of Indian residents in total applications rose from 20% in 2010-11 to approximately 44% in 2021-22.6 The Economic Survey (2020-21) emphasized that the share of resident applicants in patent applications needs to increase further for India to become a hub of innovation.[27] The Standing Committee on Commerce (2021) recommended that the government should increase awareness among small businesses, artisans, and establishments in remote areas about IPR rights.25
Figure 15: Percentage of patent applications filed by non-residents
Sources: Research and Development Statistics 2022-23; Ministry of Science and Technology; PRS.
Role of universities in R&D
The Economic Survey (2017-18) highlighted the important role that universities play in developing skilled researchers and producing high-quality papers in several countries.5 However, most publicly funded research is carried out by specialised research institutes under different government departments, leaving universities primarily as teaching centres with minimal involvement in research activities.[28] The Economic Survey (2017-18) recommended that national laboratories should be connected with universities to enhance the overall knowledge ecosystem.5
The National Education Policy, 2020 proposed the establishment of a National Research Foundation (NRF) to foster a research culture within universities.15 An outlay of Rs 50,000 crore over five years was announced in Union Budget 2021-22 for NRF. Out of this, Rs 36,000 crore, which is almost 80%, is going to come from private sources and the rest 20% will be contributed by Central Government.[29] In the 2024-25 budget, NRF has been allocated Rs 2,000 crore.2 According to the government, NRF aims to enhance the research framework by providing funding and human resources across various disciplines to elevate the quality of research in the country.2
Public procurement does not promote the adoption of new and innovative technologies
NITI Aayog (2018) has observed that public procurement tends to favour experienced and established products and technologies, which discourages new and innovative technologies offered by startups.10 It recommended that international competitive bidding should only be resorted to when Indian manufacturers are unable to supply products or services of comparable international quality. Further, committees related to public procurement should mandatorily include experts or scientific practitioners to adopt innovative technologies. Indian startups should be preferred in the technical evaluation for public procurement.
Currently, startups recognised by the Department for Promotion of Industry and Internal Trade are eligible for some incentives.30,31,32 For example, relaxation in prior turnover and prior experience requirements, subject to meeting quality and technical specifications (notified in March 2016). There is also relaxation in bid security deposit requirements (notified in July 2017).[30],[31],[32]
Startups may also work on trial orders with the government.30 Recognised startups are allowed to offer their products and services for procurement on the government’s e-marketplace platform. This is to help startups introduce unique innovations to government and public sector unit buyers.[33]
Adoption of technologies developed by public-funded research organisations is low
NITI Aayog (2018) noted that technology transfer from public-funded institutions like the Council of Scientific and Industrial Research (CSIR) was relatively low.10 To improve technology commercialisation by public-funded institutions, NITI Aayog suggested the following measures:
-
Setting up value addition centres within institutions to scale up technologies and improve their readiness level. Further, it recommended coordination with investors to support entrepreneurs and facilitate commercialisation and marketing. It suggested providing technology support during production
-
Creating a National Technology Data Bank under the Department of Science and Technology (DST) to act as a central database for ready-for-deployment or under-development technologies.
-
Directing public-funded research institutions to concentrate on developing and deploying socially relevant technologies in areas such as clean drinking water, sanitation, energy, healthcare, and organic farming, which have high potential for commercialisation.
Annexure
Table 3: Major Allocation Heads-DST (in Rs crore)
|
Particular |
Actual 2022-2023 |
2023-2024 BE |
2023-2024 RE |
2024-2025 BE |
% Change (23-24 RE to 24-25 BE) |
|
Survey of India |
476 |
531 |
458 |
534 |
17% |
|
Institutional and Human Capacity Building |
770 |
1068 |
500 |
900 |
80% |
|
Research and Development |
245 |
592 |
200 |
391 |
95% |
|
Innovation, Technology Development and Deployment |
476 |
537 |
200 |
537 |
168% |
|
National Mission on Interdisciplinary Cyber Physical Systems |
299 |
580 |
435 |
564 |
30% |
|
National Quantum Mission (NQM) |
|
|
5 |
427 |
8440% |
|
Statutory and Regulatory Bodies |
903 |
903 |
1059 |
903 |
-15% |
|
Science and Engineering Research Board |
803 |
803 |
1005 |
803 |
-20% |
|
Technology Development Board |
100 |
100 |
55 |
100 |
83% |
Sources: Expenditure Budget; PRS.
Table 4: Major Allocation Heads-DSIR (in Rs crore)
|
Particular |
Actual 2022-2023 |
2023-2024 BE |
2023-2024 RE |
2024-2025 BE |
% Change (23-24 RE to 24-25 BE) |
|
CSIR |
5804 |
5676 |
6142 |
6266 |
2% |
|
National Laboratories |
5291 |
5176 |
5712 |
5836 |
2% |
|
Capacity Building and Human Resource Development |
513 |
500 |
430 |
430 |
0% |
|
Industrial Research and Development |
17 |
23 |
15 |
17 |
13% |
|
Assistance to PSEs for Other Scientific Research Schemes |
10 |
22 |
22 |
16 |
-30% |
Sources: Expenditure Budget; PRS.
Table 5: Major Allocation Heads- DBT (in Rs crore)
|
Particular |
Actual 2022-2023 |
2023-2024 BE |
2023-2024 RE |
2024-2025 BE |
% Change (23-24 RE to 24-25 BE) |
|
Biotechnology Research and Development |
969 |
1345 |
500 |
1100 |
120% |
|
Industrial and Entrepreneurship Development |
238 |
300 |
50 |
74 |
48% |
|
Autonomous Institutions |
849 |
902 |
911 |
941 |
3% |
|
Biotechnology Industry Research Assistance Council |
33 |
40 |
52 |
40 |
-23% |
|
International Centre for Genetic Engineering and Biotechnology |
-- |
50 |
50 |
50 |
0% |
Sources: Expenditure Budget; PRS
Table 6: Details of different Initiatives
|
Initiatives |
Ministry |
Details |
|
Ministry of New and Renewable Energy |
|
|
|
National Quantum Mission[37] |
Ministry of science and technology |
|
|
National Programme on Advanced Chemistry Cell (ACC) Battery Storage[38],[39] |
Ministry of Heavy Industries |
|
|
India Semiconductor Mission[40] |
Ministry of Electronics & Information Technology |
|
|
India AI Mission[41] |
Ministry of Electronics & Information Technology |
|
|
The National Mission on Interdisciplinary Cyber Physical System (NM-ICPS)2 |
Ministry of science and technology |
|
Sources: Ministry of science and technology, Ministry of Electronics & Information Technology, Ministry of New and Renewable Energy; PRS.
[1] Research and development expenditure (% of GDP), World Bank Group, as last accessed on July 18,2024, https://data.worldbank.org/indicator/GB.XPD.RSDV.GD.ZS
[2] Demand No. 89, Department of Science and Technology, Ministry of Science and Technology, https://www.indiabudget.gov.in/doc/eb/sbe89.pdf.
[3] Demand No. 90, Department of Biotechnology, Ministry of Science and Technology, https://www.indiabudget.gov.in/doc/eb/sbe90.pdf.
[4] Demand No. 91, Department of Biotechnology, Ministry of Science and Technology, https://www.indiabudget.gov.in/doc/eb/sbe91.pdf.
[5] Chapter 8: Transforming Science and Technology in India, Volume I, Economic Survey 2017-18, https://www.thehinducentre.com/resources/article10057766.ece.
[6] S&T Indicators Tables, 2022-23, Research and Development Statistics 2022-23, Department of Science and Technology, March 2023, https://dst.gov.in/sites/default/files/S%26T%20INDICATORS%20TABLES%202023.pdf.
[7] The Science, Technology, and Innovation Policy 2013, Ministry of Science and Technology, http://dst.gov.in/sites/default/files/STI%20Policy%202013-English.pdf.
[8] Draft Science, Technology, and Innovation Policy 2020, Ministry of Science and Technology, https://dst.gov.in/sites/default/files/STIP_Doc_1.4_Dec2020.pdf.
[9] India innovation Index-2021 Report, Niti Aayog, 2021, https://www.niti.gov.in/sites/default/files/2022-07/India-Innovation-Index-2021-Web-Version_21_7_22.pdf.
[10] “Strategy for New India @75”, NITI Aayog, November 2018, https://www.niti.gov.in/sites/default/files/2019-01/Strategy_for_New_India_2.pdf.
[11] G.S.R. 776 (E), Ministry of Corporate Affairs, October 11, 2019, http://egazette.nic.in/WriteReadData/2019/213151.pdf.
[12] “Researchers in R&D (per million people)”, Data Bank, World Bank, as last accessed on July 27, 2024, https://data.worldbank.org/indicator/SP.POP.SCIE.RD.P6?end=2015&start=1996.
[13] All India Survey on Higher Education, 2021-22, Ministry of Human Resource Development, https://cdnbbsr.s3waas.gov.in/s392049debbe566ca5782a3045cf300a3c/uploads/2024/02/20240214825688998.pdf.
[14] “National Monitoring: Gross enrolment ratio by level of education”, Website of UNSECO Institute for Statistics as last accessed on July 26, 2024, http://data.uis.unesco.org/.
[15] National Education Policy 2020, Ministry of Human Resource Development, Ministry of Human Resource Development, December 2019, https://www.education.gov.in/sites/upload_files/mhrd/files/NEP_Final_English_0.pdf.
[16] Reforms and Action Points to Strengthen Science, Technology and Innovation Ecosystem in India, NITI Aayog, August, 2021, https://www.niti.gov.in/sites/default/files/2021-09/PublishedReformsinST.pdf.
[17] Report Of Committee - A On Platforms And Data On Artificial Intelligence, Ministry Of Electronics & Information Technology, July 2019, https://www.meity.gov.in/writereaddata/files/Committes_A-Report_on_Platforms.pdf.
[18] Indian Food Sectorial System of Innovation (IFSSI) Report, , Department of Science and Technology, , Ministry of Science and Technology, March 2023, https://dst.gov.in/sites/default/files/Indian%20Food%20Sectorial%20System%20of%20Innovation%20%28IFSSI%29%20Report_0.pdf.
[19] Indian Textiles Sectorial System of Innovation (ITSSI) Report, , Department of Science and Technology, Ministry of Science and Technology, March 2023, https://dst.gov.in/sites/default/files/Indian%20Textiles%20Sectorial%20System%20of%20Innovation%20%28ITSSI%29%20Report_0.pdf.
[20] Indian Automotive Sectorial System of Innovation (IASSI) Report, Department of Science and Technology, , Ministry of Science and Technology, March 2023, https://dst.gov.in/sites/default/files/Indian%20Automotive%20Sectorial%20System%20of%20Innovation%20%28IASSI%29%20Report_0.pdf.
[21] Indian Pharmaceutical Sectorial System of Innovation (IPSSI) Report, Department of Science and Technology, , Ministry of Science and Technology, March 2023, https://dst.gov.in/sites/default/files/Indian%20Pharmaceutical%20Sectorial%20System%20of%20Innovation%20%28IPSSI%29%20Report_0.pdf.
[22] Indian ICT Sectorial System of Innovation (IISSI) Report, Department of Science and Technology, , Ministry of Science and Technology, March 2023, https://dst.gov.in/sites/default/files/Indian%20ICT%20Sectorial%20System%20of%20Innovation%20%28IISSI%29%20Report_0.pdf.
[23] IP India Annual Report 2022-23 - Indian Patent Office, Department for promotion of industry and internal trade, Ministry of commerce & industry, https://ipindia.gov.in/writereaddata/Portal/IPOAnnualReport/1_114_1_ANNUAL_REPORT_202223_English.pdf.
[24] Chapter 9: Services, Economic Survey, 2021-22, https://www.indiabudget.gov.in/economicsurvey/.
[25] Report No. 161: Review of the Intellectual Property Rights Regime in India, Standing Committee on Commerce, July 23, 2021, https://www.niti.gov.in/sites/default/files/2021-02/Responsible-AI-22022021.pdf.
[26] World Intellectual Property Indicators 2023, World Intellectual Property Organization (WIPO), 2023, https://www.wipo.int/edocs/pubdocs/en/wipo-pub-941-2023-en-world-intellectual-property-indicators-2023.pdf.
[27] Chapter 8: Innovation: Trending Up but needs thrust, especially from the Private Sector, Volume I, Economic Survey 2020-21, https://www.indiabudget.gov.in/economicsurvey/doc/vol1chapter/echap08_vol1.pdf.
[28] Report No. 343: Demands for Grants (2021-2022) of the Department Of Scientific and Industrial Research, Standing Committee On Science and Technology, Environment, Forests and Climate Change, March 8, 2021, https://rajyasabha.nic.in/rsnew/Committee_site/Committee_File/ReportFile/19/147/343_2021_7_12.pdf.
[29] Parliament passes the Anusandhan National Research Foundation (NRF) Bill, 2023 with the Rajya Sabha adopting the Bill by a voice vote, Department of Science and Technology, Ministry of Science and Technology, as last accessed on July 26, 2024, https://dst.gov.in/parliament-passes-anusandhan-national-research-foundation-nrf-bill-2023-rajya-sabha-adopting-bill.
[30] “Procurement by Government”, Website of Startup India as last accessed on July 25, 2024, https://www.startupindia.gov.in/content/sih/en/public_procurement.html.
[31] Policy Circular No 1(2)(1)/2016-MA, Ministry of Micro, Small, and Medium Enterprises, March 2016, https://www.startupindia.gov.in/content/dam/invest-india/Templates/public/notification/Relaxed_Norms_of_Public_Procurement_for_Startups/1.%20Relaxed_Norms_of_Public_Procurement_for_Startups.pdf.
[32] 8 No.F.20/2/2014-PPD(Pt.), Department of Expenditure, Ministry of Finance, July 25, 2017, https://www.startupindia.gov.in/content/dam/investindia/Templates/public/notification/Relaxed_Norms_of_Public_Procurement_for_Startups/2.%20Notification_EMDExemption.pdf.
[33] 9 “Easing Public Procurement”, Website of Startup India as last accessed on July 28, 2024, https://www.startupindia.gov.in/content/sih/en/compendium_of_good_practices/easing_public_procurement.html.
[34] “Cabinet approves National Green Hydrogen Mission”, Press Information Bureau, Ministry of New and Renewable Energy, January 4, 2023, https://pib.gov.in/PressReleasePage.aspx?PRID=1888547.
[35] National Green Hydrogen Mission, Ministry of New and Renewable Energy, January 13, 2023, https://mnre.gov.in/img/documents/uploads/file_f-1673581748609.pdf.
[36] National Green Hydrogen Mission, Ministry of New And Renewable Energy, January 2023, https://cdnbbsr.s3waas.gov.in/s3716e1b8c6cd17b771da77391355749f3/uploads/2023/01/2023012338.pdf.
[37] National Quantum Mission (NQM), Department of science and technology, Ministry of science and technology, as last accessed on July 15,2024, https://dst.gov.in/national-quantum-mission-nqm
[38] “Three Companies signed Program Agreement under (PLI) Scheme for Advanced Chemistry Cell (ACC) Battery Storage”, Press Information Bureau, Ministry of Heavy Industry, July 29, 2022, https://pib.gov.in/PressReleasePage.aspx?PRID=1846078.
[39] PLI Scheme for National Programme on Advanced Chemistry Cell (ACC) Battery Storage, Ministry of Heavy Industries, as last accessed on July 15, 2024, https://heavyindustries.gov.in/pli-scheme-national-programme-advanced-chemistry-cell-acc-battery-storage
[40] “India Semiconductor Mission”, Press Information Bureau, Ministry of Electronics & IT, March 23, 2022, https://pib.gov.in/PressReleasePage.aspx?PRID=1808676
[41] “Cabinet Approves Over Rs 10,300 Crore for India AI Mission, will Empower AI Startups and Expand Compute Infrastructure Access”, Press Information Bureau, Ministry of Electronics & IT, March 7,2024, https://pib.gov.in/PressReleasePage.aspx?PRID=2012375#:~:text=Aligned%20with%20the%20broader%20vision,across%20all%20strata%20of%20society.
DISCLAIMER: This document is being furnished to you for your information. You may choose to reproduce or redistribute this report for non-commercial purposes in part or in full to any other person with due acknowledgement of PRS Legislative Research (“PRS”). The opinions expressed herein are entirely those of the author(s). PRS makes every effort to use reliable and comprehensive information, but PRS does not represent that the contents of the report are accurate or complete. PRS is an independent, not-for-profit group. This document has been prepared without regard to the objectives or opinions of those who may receive it.