As of May 5, Assam has 43 confirmed cases of COVID-19. Of these, 32 have been cured, and 1 person has died. In this blog, we summarise some key decisions taken by the Government of Assam until May 5 for containing the spread of the pandemic in the state.
Movement Restrictions
For containing the spread of COVID-19 in the state, the Government of Assam took the following measures for restricting the movement of people in the state. On March 19, the Department of Health and Family Welfare issued an order for closure of all museums, libraries, coaching centers among others until March 31.
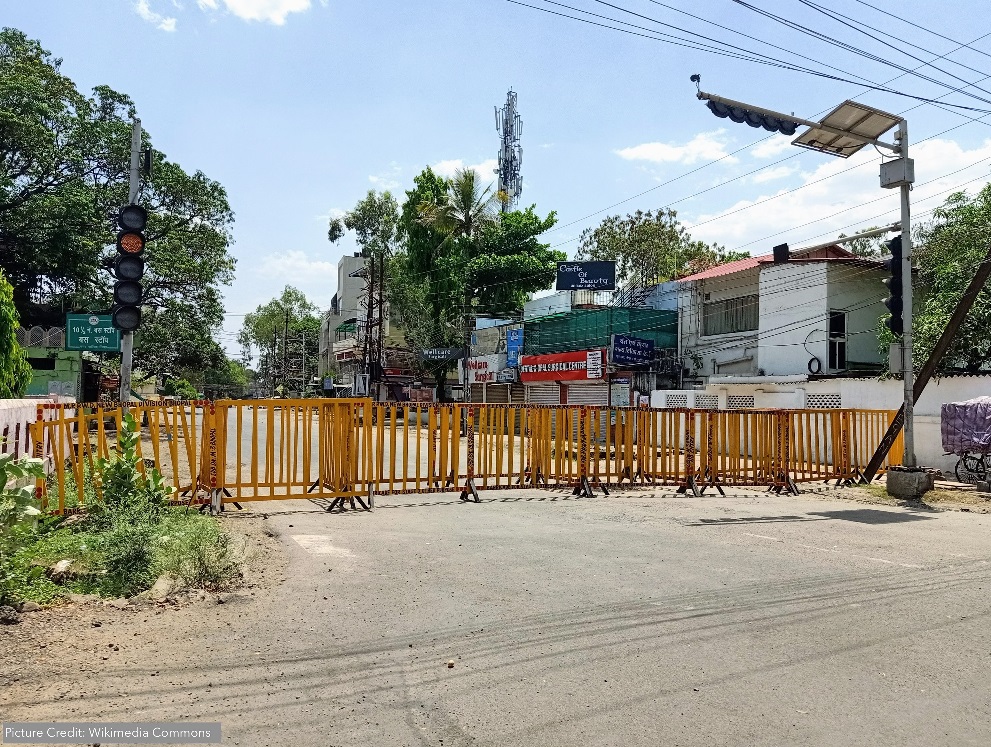
Lockdown: To further restrict the movement of individuals, in order to contain the spread of the disease, the state government enforced a state-wide lockdown from March 24 to March 31. The lockdown involved: (i) sealing the state borders, (ii) suspension of public transport services, (iii) closure of all commercial establishments, offices, and factories, and (iv) banning the congregation of more than five people at any public place. Establishments providing essential goods and services were excluded from the lockdown restrictions. Limited rituals were allowed in places of worship without any community participation.
This was followed by a nation-wide lockdown enforced by the central government between March 25 and April 14, now extended till May 18. Starting from May 4, based on the Ministry of Home Affairs guidelines, the state government has allowed certain activities with restrictions in green zones of the state. Activities such as e-commerce for all commodities, construction activities in urban areas, functioning of government and private offices among others are being allowed in green zones.
Health Measures
The Assam COVID-19 regulations, 2020: On March 18, the government issued the Assam COVID-19 regulations, 2020. These regulations are valid for one year. Key features of the regulations are as follows:
All government and private hospitals should have separate corners for the screening of COVID patients. Further, they should record the travel history of such persons during screening,
No hospital can refuse the treatment of suspected/ confirmed COVID-19 cases,
People travelled through affected areas must voluntarily report to the authorities, and
District administration can take necessary measures to contain the spread of COVID-19, such as (i) sealing a geographical area, (ii) restricting the movement of vehicles and people, and (iii) initiating active and passive surveillance of COVID-19 cases.
The Assam COVID-19 Containment Regulations, 2020: On March 21, the government issued the Assam COVID-19 Containment Regulations, 2020. These regulations detail the measures to be taken in case of community transmission within a geographical area. These include enhanced active surveillance, testing of all suspected cases, isolation of cases and home quarantine of contacts, among others.
Guidelines to Airports: On March 18, the government issued instructions regarding procedures to be followed at the airports for the screening of passengers. The guidelines allocate responsibilities such as thermal screening of passengers, counselling, transportation of passengers among others to various teams at the airports.
Medical colleges and Hospitals: On March 23, the Department of Health and Family Welfare directed all medical colleges and district hospitals to set up isolation wards. On March 27, the Department of Health and Family Welfare released measures to be followed in medical colleges and hospitals. These include: (i) seven days of training on critical care to all doctors, nurses, final year students of bachelor programs and Postgraduate students, (ii) Principals should set up a core team in every college for managing COVID-19 patients, among others.
Welfare measures
Food distribution: On March 28, the government decided to provide gratuitous relief such as rice, pulses among others to all wage earners, slum dwellers, rickshaw pullers, homeless, and migrant labourers living in municipal towns for seven days.
Minor Forest Produce (MFP): For enhancing the income of tribal farmers, the government revised rates of 10 MFPs such as honey, hill broom and added 26 new MFPs for Minimum support price in the state.
One-time financial assistance for persons stranded outside India: On March 22, the government announced one-time financial assistance of $2,000 to residents of Assam stranded in foreign countries. People who went abroad 30 days before the stoppage of international flights (on March 22) and are unable to return will receive this financial assistance.
Administrative measures
On March 21, the government constituted the task force at the State level and District level for implementation of various measures for containment of COVID-19 in the state.
On April 2, the government constituted a committee for monitoring and checking of fake news across all forms of media.
On April 29, the Department of Finance announced certain austerity measures in the context of the fiscal situation that arose due to COVID-19. These include suspension of MLA area development funds from April to July 2020, reduction in establishment expenditure, and a ban on the purchase of vehicles by the government (except ambulances and for policy duty).
For more information on the spread of COVID-19, and the central and state government response to the pandemic, please see here.
Between the last time Parliament met in March 2020 and the ongoing Monsoon session (a period of nearly six months), the government issued 941 notifications across sectors in response to the COVID-19 pandemic. It also announced a Rs 20 lakh crore economic package to improve the state of the economy and provide relief to those affected by the nationwide lockdown. In addition, the government also proposed long-term policy changes during this period in sectors such as agriculture, economy, and education.
One of the key roles of a Member of Parliament (MP) is to hold the government accountable for its policies and actions. Parliamentary questions are one of the key instruments MPs use to exercise this role. Questions help MPs seek information from the government on matters of public importance and on the status of implementation of its policies and programmes.
However, in view of the prevailing extraordinary situation due to COVID-19, both Lok Sabha and Rajya Sabha have suspended their Question Hour, which would have allowed MPs to seek oral responses from Ministers and ask follow-up questions. However, unstarred questions are admitted, for which written answers are provided.
This post provides an overview of the government’s response to some of the key questions raised by MPs during the first five days (September 14, 2020, to September 18, 2020) of the session.
Unstarred questions in the Monsoon session
A total of 1,950 unstarred questions have been asked in the first five days of the Monsoon session of the Parliament (1,150 questions in Lok Sabha and 800 questions in Rajya Sabha). The Ministries in focus for the questions were: Health (154 questions), Agriculture (127 questions), Education (104 questions), Finance (96 questions), and Railways (80 questions).
Questions ranged from the impact of the lockdown to strategy for vaccine procurement, to the status of the programmes announced to alleviate COVID related issues. Besides COVID-19, there were questions around India-China trade, locust attacks, and custodial deaths.
On COVID-19 testing and vaccine strategy
Testing data and Health infrastructure: In response to a question, the government informed that India is conducting nearly 10-11 lakh tests every day and so far, a total of 6.05 crore samples have been tested for COVID-19. Nearly 40% of the confirmed cases are persons between the age of 26-44.
To improve health capacity, as of Sep 15, a total of 15,360 COVID treatment facilities have been created with:
Vaccine development: The Central Drugs Standard Control Organisation has granted permission for conduct of clinical trials in the country to the following: (i) Bharat Biotech International Ltd. and Cadila Healthcare (these are in phase 1 and phase 2 of trials), and (ii) Serum Institute of India Pvt. Ltd (for vaccine developed by University of Oxford/AstraZeneca - this is in Phase 3, or advanced phase, of the trials).
The government is also exploring the possibility of cooperation with Russia for advancing the COVID-19 vaccine in India.
Health insurance: The Ministry noted that data on the number of healthcare workers who are infected by COVID-19 or who have lost lives during COVID duty is not maintained at the central level. As per data from the Pradhan Mantri Garib Kalyan Insurance Package, a total of 155 medical staff, including 64 doctors, have died due to COVID-19. The scheme provides an insurance cover of Rs 50 lakh (including loss of life) to healthcare providers, including community health workers, who may have come in direct contact of COVID-19 patients and who may be at risk of being impacted by this.
Under the Ayushman Bharat Scheme, a total of 4.03 lakh hospitalisations have been registered (and authorised) towards the treatment of COVID-19. Under Ayushman Bharat, the government provides health cover of five lakh rupees per family per year, for secondary and tertiary care to around 10.7 crore vulnerable families.
Impact on other health services: In light of COVID-19, that there has been a 19.4% drop in Hepatitis-B birth doses administered and a 31% drop in vaccination sessions held in health facilities and outreach sessions from April-June 2020 as compared to the same period last year. Similarly, there has been a drop of 23.9% in institutional delivery in the April-June 2020 quarter as compared to the same period last year.
Impact of COVID-19 on Indian economy
Trade: Responding to a question on the impact of COVID on exports, the government provided the following data:
India-China trade: Members also raised questions on the impact of COVID and the border issue with Ladakh on Indo-China trade. The government held that it has taken steps to balance the trade with China by increasing exports and reducing import dependence. The trade deficit with China during April-June 2020 was USD 5.5 billion as compared to USD 13.1 billion during the same period last year.
Table 1: Trade deficit with China (in billion dollars)
|
Year |
2016-17 |
2017-18 |
2018-19 |
2019-20 |
April - June 2019 |
April - June 2020 |
|
Export |
10.17 |
13.33 |
16.75 |
16.61 |
4.16 |
5.53 |
|
Import |
61.28 |
76.38 |
70.31 |
65.26 |
17.26 |
11.01 |
|
Total Trade |
71.45 |
89.71 |
87.07 |
81.87 |
21.42 |
16.55 |
|
Trade Deficit |
-51.11 |
-63.04 |
-53.56 |
-48.64 |
-13.1 |
-5.48 |
Sources: Unstarred Question No. 647, Lok Sabha, answered on September 16, 2020; PRS.
With regard to the import of Active Pharmaceutical Ingredients (bulk drugs), bulk drugs account for nearly 63% of total pharmaceutical imports in India as per government data. Of these, 68% of the bulk drugs imported by India in 2019-20 were from China.
Civil aviation: The government informed that the revenue of Indian carriers was down by nearly 86% during April-June 2020, as compared to the same period last year.
Table 2: Impact of COVID-19 on the civil aviation sector
|
Indicator |
Previously |
Now |
% Change |
|
Revenue related |
April-June 2019 |
April-June 2020 |
|
|
Revenue of Indian carriers |
Rs 25,517 crore |
Rs 3,651 crore |
-85.7% |
|
Revenue of Air India |
Rs 7,066 crore |
Rs 1,531 crore |
-78.3% |
|
Revenue of Airport Operators |
Rs 5,745 crore |
Rs 894 crore |
-84.4% |
|
Employment related |
March 31, 2020 |
July 31, 2020 |
|
|
Employment at airlines |
74,887 |
69,589 |
-7.1% |
|
Employment at airports |
67,760 |
64,514 |
-4.8% |
|
Employment at ground handling agencies |
37,720 |
29,254 |
-22.4% |
|
Employment at Cargo operators |
9,555 |
8,538 |
-10.6% |
|
Traffic related |
March-July 2019 |
March-July 2020 |
|
|
Total domestic traffic |
5,85,30,038 |
1,20,84,952 |
-79.4% |
|
Total international traffic |
93,45,469 |
11,55,590 |
-87.6% |
Sources: Unstarred Question No. 872, Lok Sabha, answered on September 17, 2020; PRS.
Vande Bharat Mission: The Vande Bharat Mission was launched on May 7, 2020 to facilitate the return of Indian nationals stranded in various countries. As of September 10, 2020, a total of 13,74,237 Indians have returned to India and the total cost incurred for this effort was Rs 22.5 crore. Of these, about 3 lakh people were working outside India. The government stated that SWADES (Skilled Workers Arrival Database for Employment Support) initiative has been launched to conduct a skill mapping exercise of the returning citizens under the Vande Bharat Mission.
Metro rail: Due to the lockdown, metro services in different cities came to a halt. This has led to a loss of Rs 1,609 crore for the Delhi Metro. The loss incurred due to the halting of the other metros was: Rs 170 crore for Bengaluru Metro, Rs 90 crore for Lucknow Metro, Rs 80 crore for Chennai Metro, and Rs 34 crore for Kochi Metro.
On Shramik special trains and Vande Bharat Mission
Railways revenue: As of August 2020, the total revenue of Railways was Rs 41,844 crore, which is a decline of 42% over the corresponding period last year. Of this, Rs 39,648 crore (95%) was freight revenue. During April to August 2020, the passenger traffic was 1.3% of the traffic in the corresponding period last year, and the freight traffic was 86.7% of the traffic seen in the corresponding period last year. The total amount of refund made to passengers due to cancellation of trains booked till April 14, 2020 (for the journey period between March 22, 2020 and August 12, 2020) was Rs 3,371 crore.
Special trains: Several members asked questions about the Shramik special trains, the number of migrant labourers who returned to their home states, and the loss of revenue to railways due to restrictions on travel and movement. The government responded that 4,621 shramik special trains were run from May 1 to August 31, 2020, which transported 63 lakh passengers across the country. Based on the data provided by states, 97 persons passed away while travelling on Shramik special trains (as of September 9, 2020). A total fare of Rs 433 crore was collected from the state governments for running these special trains.
The government also started other special trains (15 pairs of Rajdhani Express and special trains for examinations such as JEE and NEET). The average occupancy in these trains (from May 12 to August 31, 2020) was around 82%.
On Migrant labourers, relief measures and MGNREGS
A total of 1.05 crore migrant workers have returned to their home state till now (maximum to Uttar Pradesh, followed by Bihar, West Bengal, and Rajasthan). State-wise details are listed in the table below.
Table 3: Number of migrant workers who have returned to home-state (as of September 14, 2020)
|
State |
Workers who have returned to the state |
|
Uttar Pradesh |
32,49,638 |
|
Bihar |
15,00,612 |
|
West Bengal |
13,84,693 |
|
Rajasthan |
13,08,130 |
|
Madhya Pradesh |
7,53,581 |
|
Jharkhand |
5,30,047 |
|
Punjab |
5,15,642 |
|
Assam |
4,26,441 |
|
Kerala |
3,11,124 |
|
Maharashtra |
1,82,990 |
|
Tamil Nadu |
72,145 |
Sources: Unstarred Question No. 197, Lok Sabha, answered on September 14, 2020; PRS.
Responding to a question on whether free grains under the Aatma Nirbhar Scheme had reached the migrant workers, the government stated that no data on the number of migrants/stranded migrant persons across the country was available with the Department of Food Distribution and that the responsibility of identification of beneficiaries under this scheme was entrusted with states. The government informed that states have indicated about 2.8 crore migrant worker beneficiaries. As of August 31, 2020, food grains have been distributed to 2.67 crore of the identified beneficiaries for the months of June and July 2020.
MGNREGS: On whether the migrant labourers have been provided jobs under the Mahatma Gandhi National Rural Employment Guarantee Scheme (MGNREGS), the government said that there is no provision to register a job cardholder categorized as a migrant labourer in the card in the scheme. It stated that a total of 86.82 lakh new job cards have been issued this year so far, against a total of 64.96 lakh cards issued during the same period last year. The employment provided under the scheme was nearly 100% higher for the months of June and July 2020, as compared to the corresponding months in 2019. The total demand (from April 2020 to September 12, 2020) for employment under the scheme was 22.5 crore persons, a 39% increase from 16.2 crore persons for 2019-20 (during the same period).
EPF withdrawal: In March 2020, as part of the relief package, the government increased the withdrawal limit from the Employee’s Provident Fund (EPF) accounts. In areas declared to be affected by an epidemic or pandemic, members are permitted to withdraw three months’ salary or 75% of the amount lying in the member’s PF account, whichever is lesser. The government stated that a total of Rs 39,403 crore has been withdrawn from EPF from March 25, 2020 to August 31, 2020. The withdrawal was highest in the states of Maharashtra (Rs 7,838 crore), Karnataka (Rs 5,744 crore), and Tamil Nadu (Rs 4,985 crore).
Other questions
Locust attack: Several members sought to know whether the locust attacks caused damage to crops and whether the government has provided any compensation to the affected farmers. The Ministry of Agriculture responded that the locust incursions were reported in the 10 states of Bihar, Chhattisgarh, Gujarat, Haryana, Madhya Pradesh, Maharashtra, Punjab, Rajasthan, Uttarakhand, and Uttar Pradesh. The Rajasthan government has reported crop damage of 33% or more in nearly 3,400-hectare area. Haryana has reported below 33% crop damage in 6,166-hectare area. No damage was reported in Gujarat, Chhattisgarh, Punjab, and Bihar. On compensation, the government stated that pest attack has been notified as a natural disaster and states could provide relief under the State Disaster Response Fund. However, no state government has reported any data yet on the distribution of relief to affected farmers.
Functioning of virtual courts: The Ministry of Law and Justice informed that 11,93,046 hearings were done by video conferencing between March 24, 2020 and July 15, 2020 by district and subordinate courts across India. Further, it stated that to handle challenges related to COVID-19, the government has allocated nearly Rs 30 crore for providing video conferencing equipment and facilitating help desk counters for e-filing in various court complexes
Custodial deaths: The government informed that a total of 1,697 persons died under police/ judicial custody, and a total of 112 cases were registered as encounter deaths (from April 2019 to March 2020). State-wise details are noted below in Table 4 for select states (they comprise 75% of the total custodial and encounter deaths in 2019-20). On whether the government is considering a legislation to prevent the torture of individuals by police and public officials, the Ministry of Home Affairs informed that police and public order are state subjects and there is no proposal to bring a legislation in this regard.
Table 4: Custodial deaths and Encounter deaths across select states (April 2019-March 2020)
|
State |
Custodial deaths |
Encounter deaths |
|
Uttar Pradesh |
403 |
26 |
|
Madhya Pradesh |
157 |
3 |
|
West Bengal |
122 |
1 |
|
Bihar |
110 |
5 |
|
Punjab |
99 |
1 |
|
Maharashtra |
94 |
3 |
|
Rajasthan |
84 |
2 |
|
Haryana |
77 |
1 |
|
Tamil Nadu |
69 |
3 |
|
Chhattisgarh |
59 |
39 |
Sources: Unstarred Question No. 292, Lok Sabha, answered on September 15, 2020; PRS

