The central government has enforced a nation-wide lockdown between March 25 and May 3 as part of its measures to contain the spread of COVID-19. During the lockdown, several restrictions have been placed on the movement of individuals and economic activities have come to a halt barring the activities related to essential goods and services. The restrictions are being relaxed in less affected areas in a limited manner since April 20. In this blog, we look at how the lockdown has impacted the demand and supply of electricity and what possible repercussions its prolonged effect may have on the power sector.
Power supply saw a decrease of 25% during the lockdown (year-on-year)
As electricity cannot be stored in large amount, the power generation and supply for a given day are planned based on the forecast for demand. The months of January and February in 2020 had seen an increase of 3% and 7% in power supply, respectively as compared to 2019 (year-on-year). In comparison, the power supply saw a decrease of 3% between March 1 and March 24. During the lockdown between March 24 and April 19, the total power supply saw a decrease of about 25% (year-on-year).
Figure 1: % change in power supply position between March 1 and April 19 (Y-o-Y from 2019 to 2020)
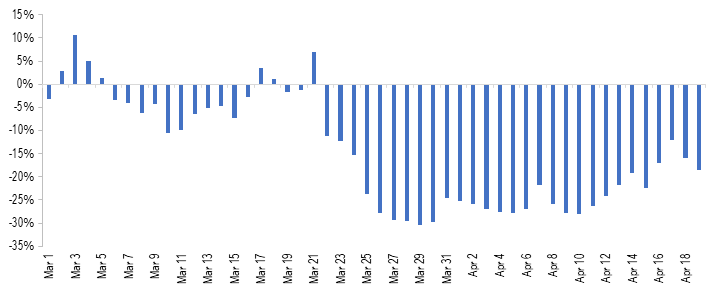
Sources: Daily Reports; POSOCO; PRS.
If we look at the consumption pattern by consumer category, in 2018-19, 41% of total electricity consumption was for industrial purposes, followed by 25% for domestic and 18% for agricultural purposes. As the lockdown has severely reduced the industrial and commercial activities in the country, these segments would have seen a considerable decline in demand for electricity. However, note that the domestic demand may have seen an uptick as people are staying indoors.
Figure 2: Power consumption by consumer segment in 2018-19
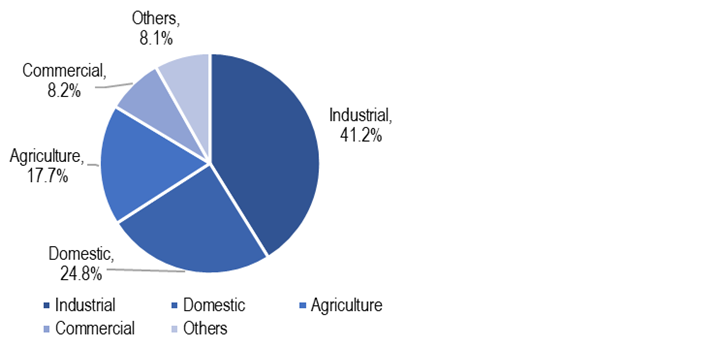
Sources: Central Electricity Authority; PRS.
Electricity demand may continue to be subdued over the next few months. At this point, it is unclear that when lockdown restrictions are eased, how soon will economic activities return to pre COVID-19 levels. India’s growth projections also highlight a slowdown in the economy in 2020 which will further impact the demand for electricity. On April 16, the International Monetary Fund has slashed its projection for India’s GDP growth in 2020 from 5.8% to 1.9%.
A nominal increase in energy and peak deficit levels
As power sector related operations have been classified as essential services, the plant operations and availability of fuel (primarily coal) have not been significantly constrained. This can be observed with the energy deficit and peak deficit levels during the lockdown period which have remained at a nominal level. Energy deficit indicates the shortfall in energy supply against the demand during the day. The average energy deficit between March 25 and April 19 has been 0.42% while the corresponding figure was 0.33% between March 1 and March 24. Similarly, the average peak deficit between March 25 and April 19 has been 0.56% as compared to 0.41% between March 1 and March 24. Peak deficit indicates the shortfall in supply against demand during highest consumption period in a day.
Figure 3: Energy deficit and peak deficit between March 1, 2020 and April 19, 2020 (in %)
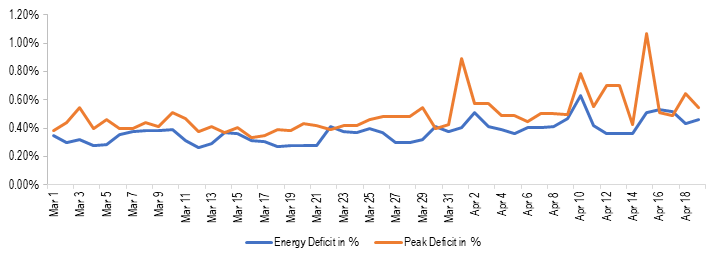
Sources: Daily Reports; POSOCO; PRS.
Coal stock with power plants increases
Coal is the primary source of power generation in the country (~71% in March 2020). During the lockdown period, the coal stock with coal power plants has seen an increase. As of April 19, total coal-stock with the power plants in the country (in days) has risen to 29 days as compared to 24 days on March 24. This indicates that the supply of coal has not been constrained during the lockdown, at least to the extent of meeting the requirements of power plants.
Energy mix changes during the lockdown, power generation from coal impacted
During the lockdown, power generation has been adjusted to compensate for reduced consumption, Most of this reduction in consumption has been adjusted by reduced coal power generation. As can be seen in Table 1, coal power generation reduced from an average of 2,511 MU between March 1 and March 24 to 1,873 MU between March 25 and April 19 (about 25%). As a result, the contribution of coal in total power generation reduced from an average of 72.5% to 65.6% between these two periods.
Table 1: Energy Mix during March 1-April 19, 2020
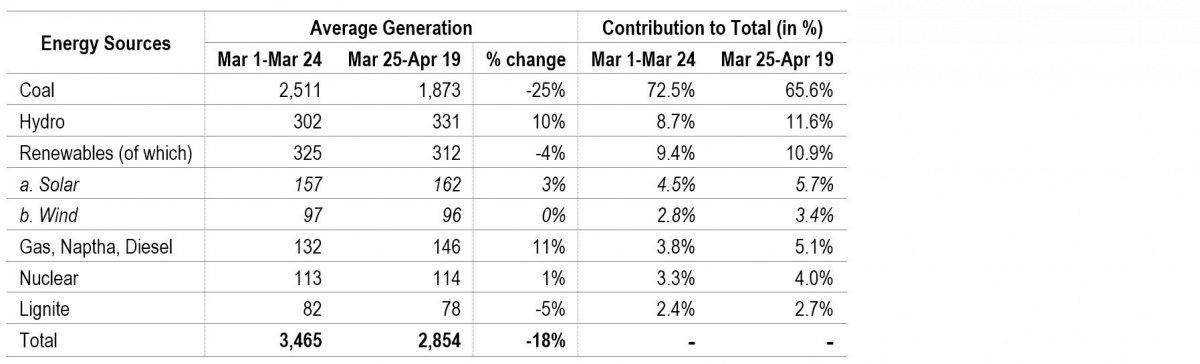
Sources: Daily Reports; POSOCO; PRS.
This shift may be happening due to various reasons including: (i) renewable energy sources (solar, wind, and small hydro) have MUST RUN status, i.e., the power generated by them has to be given the highest priority by distribution companies, and (ii) running cost of renewable power plants is lower as compared to thermal power plants.
This suggests that if growth in electricity demand were to remain weak, the adverse impact on the coal power plants could be more as compared to other power generation sources. This will also translate into weak demand for coal in the country as almost 87% of the domestic coal production is used by the power sector. Note that the plant load factor (PLF) of the thermal power plants has seen a considerable decline over the years, decreasing from 77.5% in 2009-10 to 56.4% in 2019-20. Low PLF implies that coal plants have been lying idle. Coal power plants require significant fixed costs, and they incur such costs even when the plant is lying idle. The declining capacity utilisation augmented by a weaker demand will undermine the financial viability of these plants further.
Figure 4: Power generation from coal between March 1, 2020 and April 19, 2020 (in MU)
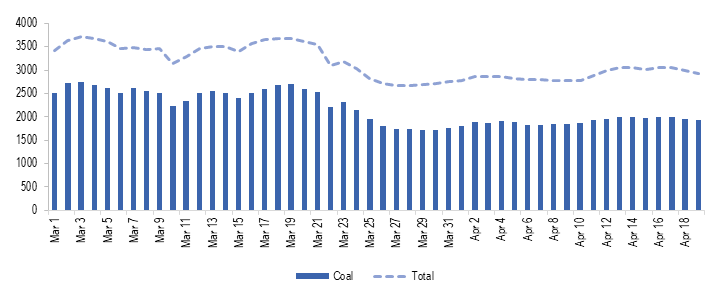
Sources: Daily Reports; POSOCO; PRS.
Finances of the power sector to be severely impacted
Power distribution companies (discoms) buy power from generation companies and supply it to consumers. In India, most of the discoms are state-owned utilities. One of the key concerns in the Indian power sector has been the poor financial health of its discoms. The discoms have had high levels of debt and have been running losses. The debt problem was partly addressed under the UDAY scheme as state governments took over 75% of the debt of state-run discoms (around 2.1 lakh crore in two years 2015-16 and 2016-17). However, discoms have continued to register losses owing to underpricing of electricity tariff for some consumer segments, and other forms of technical and commercial losses. Outstanding dues of discoms towards power generation companies have also been increasing, indicating financial stress in some discoms. At the end of February 2020, the total outstanding dues of discoms to generation companies stood at Rs 92,602 crore.
Due to the lockdown and its further impact in the near term, the financial situation of discoms is likely to be aggravated. This will also impact other entities in the value chain including generation companies and their fuel suppliers. This may lead to reduced availability of working capital for these entities and an increase in the risk of NPAs in the sector. Note that, as of February 2020, the power sector has the largest share in the deployment of domestic bank credit among industries (Rs 5.4 lakh crore, 19.3% of total).
Following are some of the factors which have impacted the financial situation during the lockdown:
Reduced cross-subsidy: In most states, the electricity tariff for domestic and agriculture consumers is lower than the actual cost of supply. Along with the subsidy by the state governments, this gap in revenue is partly compensated by charging industrial and commercial consumers at a higher rate. Hence, industrial and commercial segments cross-subsidise the power consumption by domestic and agricultural consumers.
The lockdown has led to a halt on commercial and industrial activities while people are staying indoors. This has led to a situation where the demand from the consumer segments who cross-subsidise has decreased while the demand from consumer segments who are cross-subsidised has increased. Due to this, the gap between revenue realised by discoms and cost of supply will widen, leading to further losses for discoms. States may choose to bridge this gap by providing a higher subsidy.
Moratorium to consumers: To mitigate the financial hardship of citizens due to COVID-19, some states such as Rajasthan, Uttar Pradesh, and Goa, among others, have provided consumers with a moratorium for payment of electricity bills. At the same time, the discoms are required to continue supplying electricity. This will mean that the return for the supply made in March and April will be delayed, leading to lesser cash in hand for discoms.
Some state governments such as Bihar also announced a reduction in tariff for domestic and agricultural consumers. Although, the reduction in tariff will be compensated to discoms by government subsidy.
Constraints with government finances: The revenue collection of states has been severely impacted as economic activities have come to a halt. Further, the state governments are directing their resources for funding relief measures such as food distribution, direct cash transfers, and healthcare. This may adversely affect or delay the subsidy transfer to discoms.
The UDAY scheme also requires states to progressively fund greater share in losses of discoms from their budgetary resources (10% in 2018-19, 25% in 2019-20, and 50% in 2020-21). As losses of discoms may widen due to the above-mentioned factors, the state government’s financial burden is likely to increase.
Capacity addition may be adversely impacted
As per the National Electricity Plan, India’s total capacity addition target is around 176 GW for 2017-2022. This comprises of 118 GW from renewable sources, 6.8 GW from hydro sources, and 6.4 GW from coal (apart from 47.8 GW of coal-based power projects already in various stages of production as of January 2018).
India has set a goal of installing 175 GW of Renewable Power Capacity by 2022 as part of its climate change commitments (86 GW has been installed as of January 2020). In January 2020, the Parliamentary Standing Committee on Energy observed that India could only install 82% and 55% of its annual renewable energy capacity addition targets in 2017-18 and 2018-19. As of January 2020, 67% of the target has been achieved for 2019-20.
Due to the impact of COVID-19, the capacity addition targets for various sources is likely to be adversely impacted in the short run as:
construction activities were stopped during the lockdown and will take some time to return to normal,
disruption in the global supply chain may lead to difficulties with the availability of key components leading to delay in execution of projects, for instance, for solar power plants, solar PV modules are mainly imported from China, and
reduced revenue for companies due to weak demand will leave companies with less capacity left for capital expenditure.
Key reforms likely to be delayed
Following are some of the important reforms anticipated in 2020-21 which may get delayed due to the developing situation:
The real-time market for electricity: The real-time market for electricity was to be operationalised from April 1, 2020. However, the lockdown has led to delay in completion of testing and trial runs. The revised date for implementation is now June 1, 2020.
UDAY 2.0/ADITYA: A new scheme for the financial turnaround of discoms was likely to come this year. The scheme would have provided for the installation of smart meters and incentives for rationalisation of the tariff, among other things. It remains to be seen what this scheme would be like since the situation with government finances is also going to worsen due to anticipated economic slowdown.
Auction of coal blocks for commercial mining: The Coal Ministry has been considering auction of coal mines for commercial mining this year. 100% FDI has been allowed in the coal mining activity for commercial sale of coal to attract foreign players. However, the global economic slowdown may mean that the auctions may not generate enough interest from foreign as well as domestic players.
For a detailed analysis of the Indian Power Sector, please see here. For details on the number of daily COVID-19 cases in the country and across states, please see here. For details on the major COVID-19 related notifications released by the centre and the states, please see here.
Recently, there have been reports of price crashes and distress sales in case of farm produce, such as tomatoes, mangoes, and garlic. In some cases, farmers have dumped their produce on roads. Produce such as fruits and vegetables are perishable and therefore have a short shelf life. Further, due to inadequate storage facilities and poor food processing infrastructure farmers have limited options but to sell the produce at prevailing market prices. This can lead to distress sales or roadside discards (in some cases to avoid additional cost of transportation).
Food processing allows raw food to be stored, marketed, or preserved for consumption later. For instance, raw agricultural produce such as fruits may be processed into juices, jams, and pickles. Activities such as waxing (for preservation), packaging, labelling, or ripening of produce also form part of the food processing industry.
Between 2001-02 and 2016-17, production of food grains grew annually at 1.7% on average. Production of horticulture crops surpassed food grains with an average growth rate of 4.8%. While production has been increasing over the years, surplus produce tends to go waste at various stages such as procurement, storage, and processing due to lack of infrastructure such as cold storages and food processing units.

Source: Horticulture Statistics at a Glance 2017, Union Budget 2018-19; PRS.
Losses high among perishables such as fruits and vegetables
Crop losses ranged between 7-16% among fruits and around 5% among cereals in 2015. The highest losses were witnessed in case of guava, followed by mango, which are perishable fruits. Perishables such as fruits and vegetables are more prone to losses as compared to cereals. Such crop losses can occur during operations such as harvesting, thrashing, grading, drying, packaging, transportation, and storage depending upon the commodity.
It was estimated that the annual value of harvest and post-harvest losses of major agricultural products at the national level was Rs 92,651 crore in 2015. The Standing Committee on Agriculture (2017) stated that such wastage can be reduced with adequate food processing facilities.

Sources: Annual Report 2016-17, Ministry of Food Processing Industries; PRS.
Inadequate food processing infrastructure
As previously discussed, perishables such as fruits and vegetables are more prone to damages as compared to cereals. Due to inadequate processing facilities in close proximity, farmers may be unable to hold their produce for a long time. Hence, they may be forced to sell their produce soon after harvest, irrespective of the prevailing market situations. Expert committees have recommended that agri-logistics such as cold chain infrastructure and market linkages should be strengthened.
Cold chain infrastructure: Cold chain infrastructure includes processing units, cold storages, and refrigerated vans. As of 2014, out of a required cold storage capacity of 35 million metric tonnes (MT), almost 90% (31.8 million MT) of the capacity was available (see Table 1). However, cold storage needs to be coupled with logistical support to facilitate smooth transfer of harvested value from farms to distant locations. This includes: (i) pack-houses for packaging and preparing fresh produce for long distance transport, (ii) refrigerated transport such as reefer vehicles, and (iii) ripening chambers to ripen raw produce before marketing. For instance, bananas which are harvested raw may be ripened in these chambers before being marketed.
While there are sufficient cold storages, there are wide gaps in the availability of other associated infrastructure. This implies that even though almost 90% (32 million tonnes) of cold storage capacity is available, only 15% of the required refrigerated transport exists. Further, the shortfall in the availability of infrastructure necessary for safe handling of farm produce, like pack-houses and ripening chambers, is over 90%.
Table 1: Gaps in cold chain infrastructure (2014)
| Facility | Required | Available | Gap | % gap |
| Cold storage (in million MT) |
35.1 |
31.8 | 3.2 |
9.3% |
| Pack-houses |
70,080 |
249 | 69,831 |
99.6% |
| Reefer vehicles |
61,826 |
9,000 | 52,826 |
85.4% |
| Ripening chambers |
9,131 |
812 | 8,319 |
91.1% |
To minimise post-harvest losses, the Standing Committee (2017) recommended that a country-wide integrated cold chain infrastructure network at block and district levels should be created. It further recommended that a Cold Chain Coordination and Monitoring Committee should be constituted at the district-level. The Standing Committee also recommended that farmers need to be trained in value addition activities such as sorting, grading, and pre-cooling harvested produce through facilities such as freezers and ripening chambers.
Between 2008 and 2017, 238 cold chain projects were sanctioned under the Scheme for Integrated Cold Chain and Value Addition Infrastructure. Grants worth Rs 1,775 crore were approved for these projects. Of this amount, Rs 964 crore (54%) has been released as of January 2018. Consequently, out of the total projects sanctioned, 114 (48%) are completed. The remaining 124 projects are currently under implementation.
Transport Facilities: Currently, majority of food grains and certain quantities of tea, potato, and onion are transported through railways. The Committee on Doubling Farmers Income had recommended that railways needs to upgrade its logistics to facilitate the transport of fresh produce directly to export hubs. This includes creation of adjoining facilities for loading and unloading, and distribution to road transport.
Mega Food Parks: The Mega Food Parks scheme was launched in 2008. It seeks to facilitate setting up of food processing units. These units are to be located at a central processing centre with infrastructure required for processing, packaging, quality control labs, and trade facilitation centres.
As of March 2018, out of the 42 projects approved, 10 were operational. The Standing Committee on Agriculture noted certain reasons for delay in implementation of projects under the scheme. These include: (i) difficulty in getting loans from banks for the project, (ii) delay in obtaining clearances from the state governments and agencies for roads, power, and water at the project site, (iii) lack of special incentives for setting up food processing units in Mega Food Parks, and (iv) unwillingness of the co-promoters in contributing their share of equity.
Further, the Standing Committee stated that as the scheme requires a minimum area of 50 acres, it does not to promote smaller or individual food processing and preservation units. It recommended that smaller agro-processing clusters near production areas must be promoted. The Committee on Doubling Farmers Income recommended establishment of processing and value addition units at strategic places. This includes rural or production areas for pulses, millets, fruits, vegetables, dairy, fisheries, and poultry in public private-partnership mode.

