The central government has enforced a nation-wide lockdown between March 25 and May 3 as part of its measures to contain the spread of COVID-19. During the lockdown, several restrictions have been placed on the movement of individuals and economic activities have come to a halt barring the activities related to essential goods and services. The restrictions are being relaxed in less affected areas in a limited manner since April 20. In this blog, we look at how the lockdown has impacted the demand and supply of electricity and what possible repercussions its prolonged effect may have on the power sector.
Power supply saw a decrease of 25% during the lockdown (year-on-year)
As electricity cannot be stored in large amount, the power generation and supply for a given day are planned based on the forecast for demand. The months of January and February in 2020 had seen an increase of 3% and 7% in power supply, respectively as compared to 2019 (year-on-year). In comparison, the power supply saw a decrease of 3% between March 1 and March 24. During the lockdown between March 24 and April 19, the total power supply saw a decrease of about 25% (year-on-year).
Figure 1: % change in power supply position between March 1 and April 19 (Y-o-Y from 2019 to 2020)
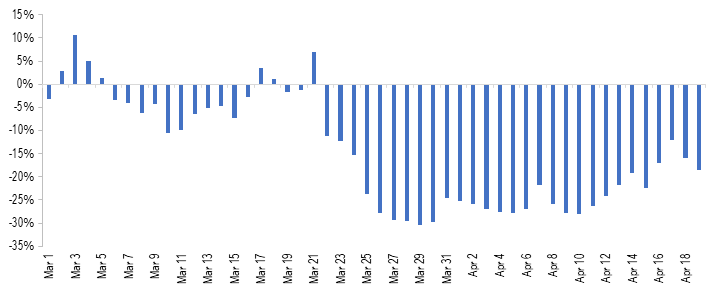
Sources: Daily Reports; POSOCO; PRS.
If we look at the consumption pattern by consumer category, in 2018-19, 41% of total electricity consumption was for industrial purposes, followed by 25% for domestic and 18% for agricultural purposes. As the lockdown has severely reduced the industrial and commercial activities in the country, these segments would have seen a considerable decline in demand for electricity. However, note that the domestic demand may have seen an uptick as people are staying indoors.
Figure 2: Power consumption by consumer segment in 2018-19
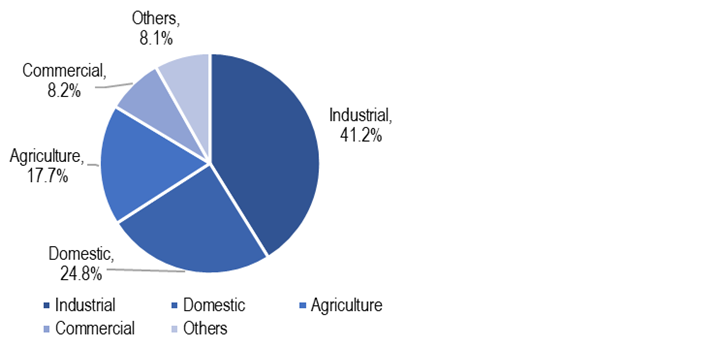
Sources: Central Electricity Authority; PRS.
Electricity demand may continue to be subdued over the next few months. At this point, it is unclear that when lockdown restrictions are eased, how soon will economic activities return to pre COVID-19 levels. India’s growth projections also highlight a slowdown in the economy in 2020 which will further impact the demand for electricity. On April 16, the International Monetary Fund has slashed its projection for India’s GDP growth in 2020 from 5.8% to 1.9%.
A nominal increase in energy and peak deficit levels
As power sector related operations have been classified as essential services, the plant operations and availability of fuel (primarily coal) have not been significantly constrained. This can be observed with the energy deficit and peak deficit levels during the lockdown period which have remained at a nominal level. Energy deficit indicates the shortfall in energy supply against the demand during the day. The average energy deficit between March 25 and April 19 has been 0.42% while the corresponding figure was 0.33% between March 1 and March 24. Similarly, the average peak deficit between March 25 and April 19 has been 0.56% as compared to 0.41% between March 1 and March 24. Peak deficit indicates the shortfall in supply against demand during highest consumption period in a day.
Figure 3: Energy deficit and peak deficit between March 1, 2020 and April 19, 2020 (in %)
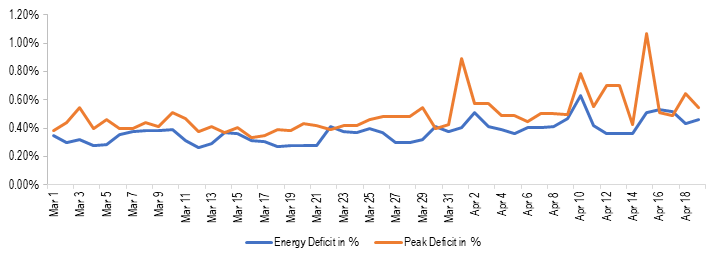
Sources: Daily Reports; POSOCO; PRS.
Coal stock with power plants increases
Coal is the primary source of power generation in the country (~71% in March 2020). During the lockdown period, the coal stock with coal power plants has seen an increase. As of April 19, total coal-stock with the power plants in the country (in days) has risen to 29 days as compared to 24 days on March 24. This indicates that the supply of coal has not been constrained during the lockdown, at least to the extent of meeting the requirements of power plants.
Energy mix changes during the lockdown, power generation from coal impacted
During the lockdown, power generation has been adjusted to compensate for reduced consumption, Most of this reduction in consumption has been adjusted by reduced coal power generation. As can be seen in Table 1, coal power generation reduced from an average of 2,511 MU between March 1 and March 24 to 1,873 MU between March 25 and April 19 (about 25%). As a result, the contribution of coal in total power generation reduced from an average of 72.5% to 65.6% between these two periods.
Table 1: Energy Mix during March 1-April 19, 2020
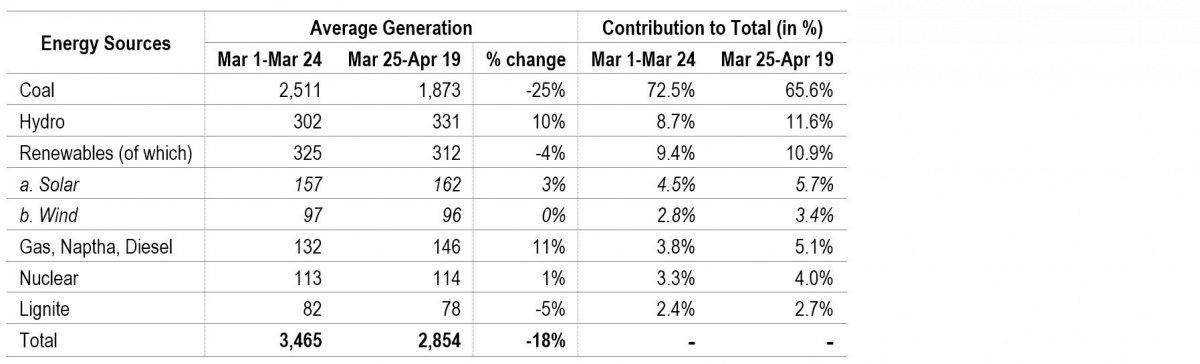
Sources: Daily Reports; POSOCO; PRS.
This shift may be happening due to various reasons including: (i) renewable energy sources (solar, wind, and small hydro) have MUST RUN status, i.e., the power generated by them has to be given the highest priority by distribution companies, and (ii) running cost of renewable power plants is lower as compared to thermal power plants.
This suggests that if growth in electricity demand were to remain weak, the adverse impact on the coal power plants could be more as compared to other power generation sources. This will also translate into weak demand for coal in the country as almost 87% of the domestic coal production is used by the power sector. Note that the plant load factor (PLF) of the thermal power plants has seen a considerable decline over the years, decreasing from 77.5% in 2009-10 to 56.4% in 2019-20. Low PLF implies that coal plants have been lying idle. Coal power plants require significant fixed costs, and they incur such costs even when the plant is lying idle. The declining capacity utilisation augmented by a weaker demand will undermine the financial viability of these plants further.
Figure 4: Power generation from coal between March 1, 2020 and April 19, 2020 (in MU)
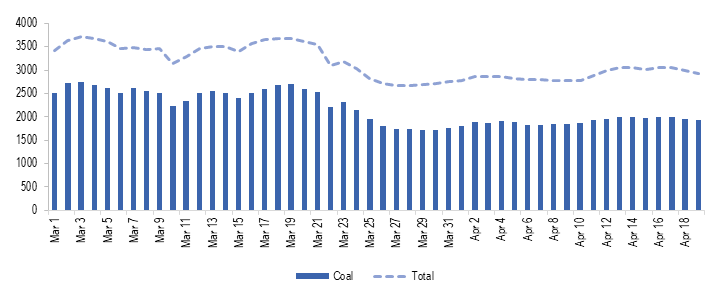
Sources: Daily Reports; POSOCO; PRS.
Finances of the power sector to be severely impacted
Power distribution companies (discoms) buy power from generation companies and supply it to consumers. In India, most of the discoms are state-owned utilities. One of the key concerns in the Indian power sector has been the poor financial health of its discoms. The discoms have had high levels of debt and have been running losses. The debt problem was partly addressed under the UDAY scheme as state governments took over 75% of the debt of state-run discoms (around 2.1 lakh crore in two years 2015-16 and 2016-17). However, discoms have continued to register losses owing to underpricing of electricity tariff for some consumer segments, and other forms of technical and commercial losses. Outstanding dues of discoms towards power generation companies have also been increasing, indicating financial stress in some discoms. At the end of February 2020, the total outstanding dues of discoms to generation companies stood at Rs 92,602 crore.
Due to the lockdown and its further impact in the near term, the financial situation of discoms is likely to be aggravated. This will also impact other entities in the value chain including generation companies and their fuel suppliers. This may lead to reduced availability of working capital for these entities and an increase in the risk of NPAs in the sector. Note that, as of February 2020, the power sector has the largest share in the deployment of domestic bank credit among industries (Rs 5.4 lakh crore, 19.3% of total).
Following are some of the factors which have impacted the financial situation during the lockdown:
Reduced cross-subsidy: In most states, the electricity tariff for domestic and agriculture consumers is lower than the actual cost of supply. Along with the subsidy by the state governments, this gap in revenue is partly compensated by charging industrial and commercial consumers at a higher rate. Hence, industrial and commercial segments cross-subsidise the power consumption by domestic and agricultural consumers.
The lockdown has led to a halt on commercial and industrial activities while people are staying indoors. This has led to a situation where the demand from the consumer segments who cross-subsidise has decreased while the demand from consumer segments who are cross-subsidised has increased. Due to this, the gap between revenue realised by discoms and cost of supply will widen, leading to further losses for discoms. States may choose to bridge this gap by providing a higher subsidy.
Moratorium to consumers: To mitigate the financial hardship of citizens due to COVID-19, some states such as Rajasthan, Uttar Pradesh, and Goa, among others, have provided consumers with a moratorium for payment of electricity bills. At the same time, the discoms are required to continue supplying electricity. This will mean that the return for the supply made in March and April will be delayed, leading to lesser cash in hand for discoms.
Some state governments such as Bihar also announced a reduction in tariff for domestic and agricultural consumers. Although, the reduction in tariff will be compensated to discoms by government subsidy.
Constraints with government finances: The revenue collection of states has been severely impacted as economic activities have come to a halt. Further, the state governments are directing their resources for funding relief measures such as food distribution, direct cash transfers, and healthcare. This may adversely affect or delay the subsidy transfer to discoms.
The UDAY scheme also requires states to progressively fund greater share in losses of discoms from their budgetary resources (10% in 2018-19, 25% in 2019-20, and 50% in 2020-21). As losses of discoms may widen due to the above-mentioned factors, the state government’s financial burden is likely to increase.
Capacity addition may be adversely impacted
As per the National Electricity Plan, India’s total capacity addition target is around 176 GW for 2017-2022. This comprises of 118 GW from renewable sources, 6.8 GW from hydro sources, and 6.4 GW from coal (apart from 47.8 GW of coal-based power projects already in various stages of production as of January 2018).
India has set a goal of installing 175 GW of Renewable Power Capacity by 2022 as part of its climate change commitments (86 GW has been installed as of January 2020). In January 2020, the Parliamentary Standing Committee on Energy observed that India could only install 82% and 55% of its annual renewable energy capacity addition targets in 2017-18 and 2018-19. As of January 2020, 67% of the target has been achieved for 2019-20.
Due to the impact of COVID-19, the capacity addition targets for various sources is likely to be adversely impacted in the short run as:
construction activities were stopped during the lockdown and will take some time to return to normal,
disruption in the global supply chain may lead to difficulties with the availability of key components leading to delay in execution of projects, for instance, for solar power plants, solar PV modules are mainly imported from China, and
reduced revenue for companies due to weak demand will leave companies with less capacity left for capital expenditure.
Key reforms likely to be delayed
Following are some of the important reforms anticipated in 2020-21 which may get delayed due to the developing situation:
The real-time market for electricity: The real-time market for electricity was to be operationalised from April 1, 2020. However, the lockdown has led to delay in completion of testing and trial runs. The revised date for implementation is now June 1, 2020.
UDAY 2.0/ADITYA: A new scheme for the financial turnaround of discoms was likely to come this year. The scheme would have provided for the installation of smart meters and incentives for rationalisation of the tariff, among other things. It remains to be seen what this scheme would be like since the situation with government finances is also going to worsen due to anticipated economic slowdown.
Auction of coal blocks for commercial mining: The Coal Ministry has been considering auction of coal mines for commercial mining this year. 100% FDI has been allowed in the coal mining activity for commercial sale of coal to attract foreign players. However, the global economic slowdown may mean that the auctions may not generate enough interest from foreign as well as domestic players.
For a detailed analysis of the Indian Power Sector, please see here. For details on the number of daily COVID-19 cases in the country and across states, please see here. For details on the major COVID-19 related notifications released by the centre and the states, please see here.
In the last decade, the government has implemented several schemes to address issues related to urbanisation and aid the process of urban development. One of the schemes is the Smart Cities Mission, which intends to take advantage of the developments in information technology in developing the urban development strategy, across 100 cities. Last week the government announced the list of 9 new Smart Cities, taking the total to 99. In light of this, we look at the Smart Cities Mission and a few issues with it.
What is a Smart City?
The primary objective of the Mission is to develop cities that provide core infrastructure and give a decent quality of life to its citizens, a clean and sustainable environment, and apply ‘smart’ solutions.
However, the Mission document does not provide one definition of a Smart City. Instead it allows cities to come up with their own solutions of what they identify as a Smart City. The guidelines suggest that the core infrastructure elements in a Smart City will include: (i) adequate water supply, (ii) assured electricity supply, (iii) sanitation, including solid waste management, (iv) efficient urban mobility and public transport, (v) affordable housing, (vi) robust IT connectivity, and (vii) good governance. ‘Smart’ solutions may include (i) energy efficient buildings, (ii) electronic service delivery, (iii) intelligent traffic management, (iv) smart metering, (v) citizen engagement, etc.
How were the Smart Cities selected?
The Mission was introduced in the form of a competition, called the Smart City challenge. The first stage was in July 2015 when states nominated their cities for the competition. In August 2015, the Ministry of Urban Development selected 100 of those cities to participate in the competition. These cities were required to develop their smart city plans (SCPs) and compete against each other. The SCPs were evaluated on the basis of the solutions, the processes followed, the feasibility and cost effectiveness of the plans, and citizen engagement. Over the last 2 years, the Ministry has announced winner cities in batches. So far, 99 cities have been selected under the Mission.
What information do these SCPs contain?
The cities had to prepare their SCPs with two primary strategic components: (i) area-based development, and (ii) pan-city development. The area-based development would cover a particular area of the city, and could have either a redevelopment model, or be a completely new development. Pan-city development would envisage application of certain smart solutions across the city to the existing infrastructure.
Each city had to formulate its own concept, vision, mission and plan for a Smart City that was appropriate to its local context and resources. The Ministry of Urban Development provided technical assistance, through consultancy firms, to cities for helping them prepare these strategic documents.
How will the Mission be implemented?
The Mission will be implemented at the city level by a Special Purpose Vehicle (SPV). The SPV will plan, approve, release funds, implement, manage, monitor, and evaluate the Smart City development projects.
The SPV will be a limited company incorporated under the Companies Act, 2013 at the city-level. It will be chaired by the Collector/ Municipal Commissioner of the Urban Development Authority. The respective state and the Urban Local Body (ULB or municipality) will be the promoters in this company having 50:50 equity shareholding.
How are the Plans getting financed?
The Mission will be operated as a Centrally Sponsored Scheme. The central government will provide financial support of up to Rs 48,000 crore over five years, that is, an average of Rs 500 crore per city. The states and ULBs will have to contribute an equal amount. The central government allocated Rs 4,000 crore towards the Mission in the 2017-18 budget.
Since funding from the government will meet only a part of the funding required, the rest will have to be raised from other sources including: (i) states/ ULBs own resources from collection of user fees, land monetization, etc., (ii) innovative finance mechanisms such as municipal bonds, (iii) leverage borrowings from financial institutions (such as banks), and (iv) the private sector through Public Private Partnerships (PPPs).
The total cost of projects proposed under the various SCPs of the 90 winner cities is Rs 1.9 lakh crore. About 42% of this amount will come from central and state funding, 23% through private investments and PPPs, and 19% through convergence with other schemes (such as HRIDAY, AMRUT, Swachh Bharat-Urban). The remaining will be generated by the cities through the levy of local taxes, and user fees.
What are some of the issues to consider?
Financial capacity of cities: Under the Mission, cities have to generate additional revenue through various sources including market borrowings, PPPs, and land monetization. The High Powered Expert Committee on Indian Urban Infrastructure and Services (HPEC) had observed that ULBs in India are among the weakest in the world, both in terms of capacity to raise resources and financial autonomy. Even though ULBs have been getting higher allocations from the centre and states, and tax devolution to them has increased, their own tax bases are narrow. Further, owing to their poor governance and financial situation, ULBs find it difficult to access external financing.
Such a situation may pose problems when implementing the Mission, where the ULBs have to raise a significant share of the revenue through external sources (PPPs, market borrowings). For example, the Bhubaneswar Smart City Plan has a total project cost of Rs 4,537 crore (over five years), while the city’s annual budget for 2014-15 was Rs 469 crore.
In order to improve the finances of the ULBs, committees have made various recommendations, which include:
The government has recently introduced a few policies and mechanisms to address municipal financing. Examples include value capture financing through public investments in infrastructure projects, and a credit rating system for cities. In June 2017, the Pune Municipal Corporation raised Rs 200 crore by issuing municipal bonds.
Technical capacity of the ULBs: The Smart Cities Mission seeks to empower ULBs to raise their own revenue, and also lays emphasis on the capacity building of ULBs. The HPEC had observed that municipal administration has suffered due to: (i) presence of untrained and unskilled manpower, and (ii) shortage of qualified technical staff and managerial supervisors. It had recommended improving the technical capacity of ULBs by providing technical assistance to state governments, and ULBs in planning, financing, monitoring, and operation of urban programmes. The central government had allocated Rs 10.5 crore towards the capacity building component of the Mission in 2017-18.
The Ministry of Urban Development has been running several programmes to improve capacity of ULBs. This includes MoUs with 18 states to conduct training programmes for their ULB staff.
Coverage of the Mission: The Mission covers 100 cities, of which 99 have been announced as winners so far. The urban population that will be impacted through the Mission is around 96 million (data for 90 cities excluding the recently announced 9 cities).
As per Census 2011, India’s urban population was 377 million. The Mission impacts about 25% of this population. Further, most of the SCPs approved so far focus on area-based development, thus affecting a particular area of the cities. About 80% of the total project cost proposed is towards this model of development. In each city, this area-based development will cover up to 50 acres of area. The remaining 20% of the project cost is towards pan-city development proposals, which provide smart planning solutions for the entire city. It may be argued that even within the selected cities, the Mission will only impact few selected areas, and not necessarily help with development of the entire city.

